Troubleshooting
A practical triage guide for the problems that bring users to support: you can't log in, an asset you expected isn't showing up, the numbers look wrong or stale, a button does nothing, or an export won't download. Most of these have a self-service fix. This page routes you to it, and shows you how to reach a human when it doesn't.
Overview
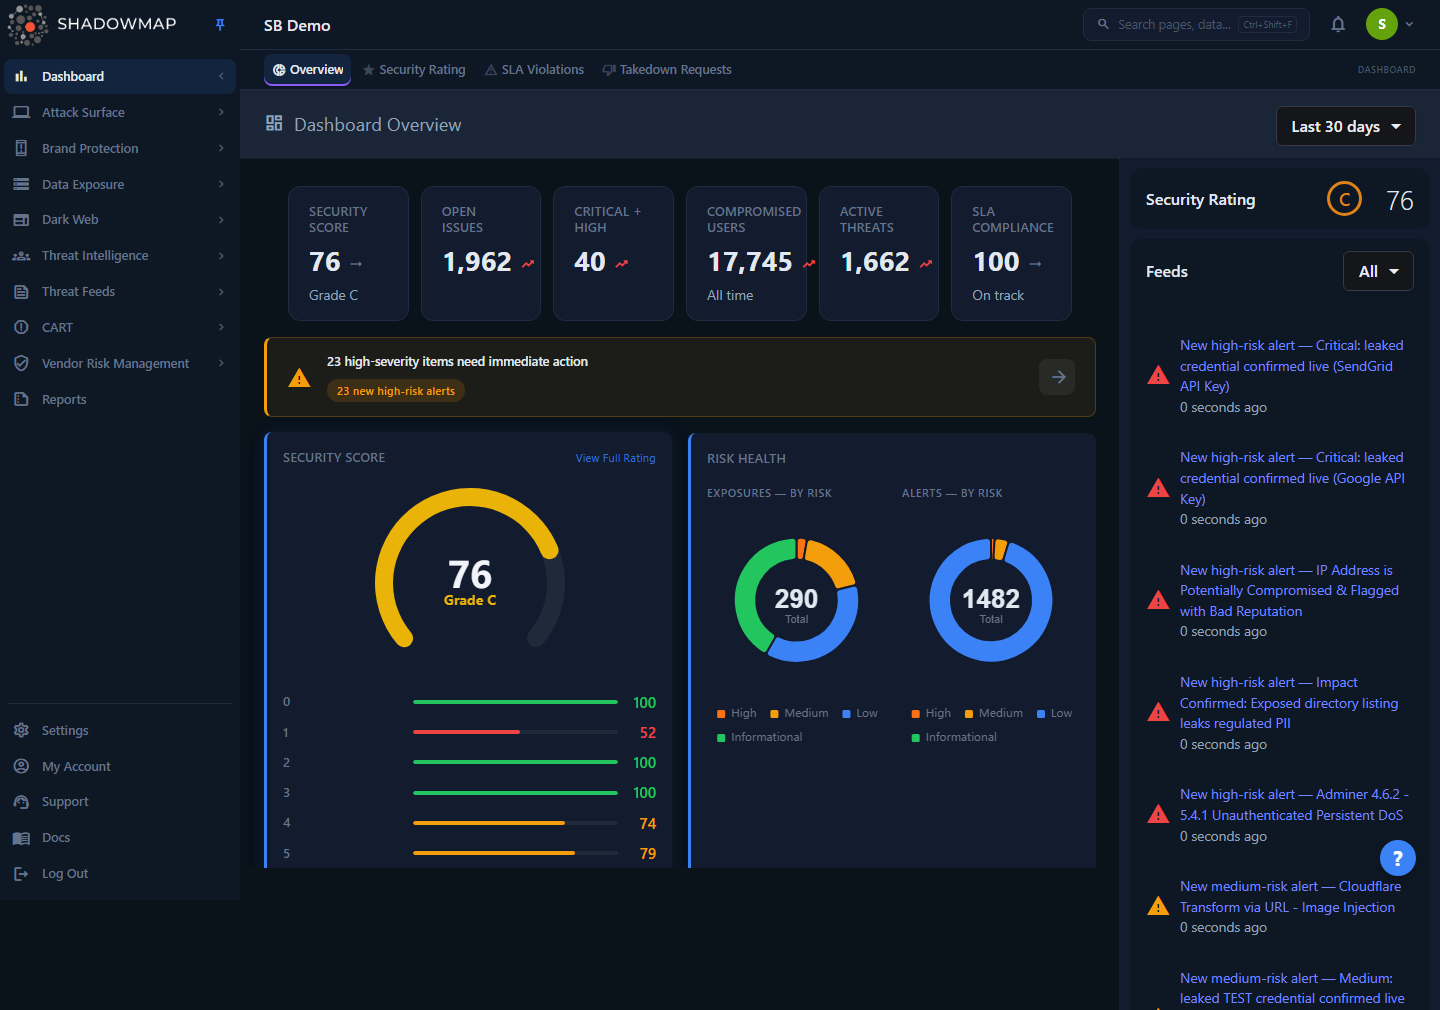
The Dashboard Overview is the landing page most users start (and get stuck) on. Many "something is broken" reports are actually scope, permission, or data-freshness questions — this section helps you tell the difference.
ShadowMap is an external attack surface management (EASM) platform. It discovers and monitors your internet-facing assets, brand exposure, dark-web leaks, and threat intelligence from the outside — the way an attacker sees you. That architecture matters for troubleshooting: there is no agent on your network, nothing for you to "point at" an asset, and findings only appear after a scan has reached the asset. A large share of "missing data" reports trace back to one of three causes — the asset is genuinely out of scope, your role can't see the module, or a scan hasn't completed yet — none of which is a bug.
This page is the hub for the section. Use the triage table to jump to the dedicated page for your symptom, or work through the quick self-checks below first — they resolve the majority of cases in under a minute.
How it works
Understanding how ShadowMap produces what you see explains most "something is wrong" reports before they become tickets:
- Data is scan-driven, not live. Each module is populated by its own scan running on its own cadence — some assets are revisited more often than others. A change you just made (a port you closed, a certificate you rotated, a finding you remediated) won't update in ShadowMap until the next scan reaches that asset and confirms it. Remediation is verified on re-scan, not on your say-so.
- What you see is scoped by your role and tenant. The sidebar only shows modules your role is permitted to see and that are enabled for your tenant. A module a teammate sees but you don't is a permissions difference, not a defect.
- The same number can be scoped differently across surfaces. An overview card, a module list, and an export each apply their own filters and status scope, so they can legitimately disagree until you normalize the date range and filters.
- Most views default to a recent window. Many pages open on a Last 30 days range, and your selection is remembered per module in browser local storage — so a narrow range set earlier can persist and hide older findings until you widen it (up to All time).
When a report traces back to one of these, it isn't a bug — it's how external attack surface monitoring works. The sections below help you tell the difference quickly.
Triage: find your symptom
| Symptom | Most likely cause | Go to |
|---|---|---|
| Can't sign in; password rejected; 2FA code not accepted; locked out | Wrong tenant URL, clock skew on the authenticator, or a 2FA reset is needed | Login and 2FA Issues |
| A domain, subdomain, IP, or other asset you expect is not listed | Out of scope, not yet discovered, filtered out, or hidden by your role | Missing Assets |
| A whole module or menu item is missing from the sidebar | Your role lacks the permission, or the module isn't enabled for your tenant | Roles and Permissions |
| Numbers look stale, or a recent change isn't reflected | Last scan hasn't run yet, or browser is showing a cached page | Data looks stale below |
| A finding's count differs between the overview card, the list, and an export | Each surface scopes the same data slightly differently | Counts don't match below |
| An export or report won't download, or the link expired | Generation still running, expired link, or a pop-up/download block | Exports and reports below |
| A page is blank, a button does nothing, or the UI looks broken | Stale front-end build cached in the browser | The page looks broken below |
| Anything else, or the above didn't help | — | Contacting Support |
Triage in order
Work top-down: confirm you're on the right account and your role can see the thing, then confirm a scan has actually run, then rule out a browser cache. Only then is it likely a real defect worth a support ticket.
How support works in ShadowMap
ShadowMap has an in-app Support menu, so you rarely need to leave the dashboard to get help. The same menu is available from two places:
- The bottom of the left icon rail — the
support_agenticon labelled Support. - The user menu in the top navigation bar — open the account dropdown and choose Support.
Opening it presents three routes, each tailored to a different kind of request:
| Option | Use it for | What you submit |
|---|---|---|
| Raise a Support Ticket | Account help, access problems, data questions, general inquiries | Ticket Type (Feature Request / Bug Report / Data Request / General Inquiry), Priority (Low / Medium / High / Critical), Subject, Description, your name and email |
| Report a Bug | Something in the product is not working correctly | Title, Description, optional Module/Page, optional screenshot (drag-and-drop, max 10 MB; PNG/JPG/GIF/WebP) |
| Request a Feature | An idea to improve ShadowMap | A description of the request |
Your name, email, and organization are pre-filled from your profile and attached automatically, so the support team always knows who and which tenant a request came from. Submissions email the support team directly; you'll get a toast confirming the ticket was sent.
Reaching support without the in-app menu
If you can't log in — and therefore can't open the menu — email [email protected] directly. That address is the same destination the in-app forms route to. See Contacting Support for what to include so the team can act on the first reply.
Quick self-checks
These four checks resolve most reports without a ticket. They're ordered cheapest-first.
The page looks broken, or a button does nothing
ShadowMap is a single-page application. When a new front-end build ships, a browser holding the previous build in cache can render a blank page, a half-loaded view, or controls that silently do nothing.
- Hard refresh the page to force a fresh build:
Ctrl+Shift+R(Windows/Linux) orCmd+Shift+R(macOS). - If that doesn't clear it, open the dashboard in a private/incognito window — this bypasses cache and extensions in one step.
- If the private window works, clear cached files for the site in your normal browser, or disable browser extensions one at a time (ad/script blockers are the usual culprits).
- Confirm you're on a current, mainstream browser (latest Chrome, Edge, Firefox, or Safari). Embedded or very old browsers are not supported.
Don't confuse "broken" with "empty"
A page that loads cleanly but shows no rows is usually not broken — it's an empty result set. That points to scope, a filter you forgot to clear, or a scan that hasn't populated the module yet. Jump to Missing Assets instead.
Data looks stale, or wrong
ShadowMap data is scan-driven, not live. Each module is refreshed by its own scan on its own cadence — some assets are revisited more frequently than others — so a change you just made on your infrastructure (a port you closed, a certificate you rotated, a finding you remediated) will not disappear from ShadowMap until the next scan reaches that asset and confirms the change.
Before assuming the data is wrong:
- Check the date-range selector in the page header. Many dashboards default to Last 30 days; widen it to All time to confirm a finding isn't simply outside the current window. Your range selection is remembered in browser local storage, so a narrow range set earlier can persist across visits.
- Remember that remediation is confirmed on re-scan, not on your say-so. A fixed issue stays visible (often in a "Resolved/Closed" state) until ShadowMap re-checks the asset.
- Findings themselves are retained for the life of your subscription. If something vanished rather than going stale, that's a scope or filter change, not retention. See Data Retention.
Counts don't match between views
It's normal for the same metric to read differently in an overview card, a module list, and an export. Each surface applies its own scoping — an overview card may count every record ever seen, a list may default to "open" items only, and an export honors whatever filters were active when you ran it. To compare like-for-like:
- Clear all filters and search terms on the list.
- Set the date range to All time.
- Match the status/severity scope (e.g. include closed/resolved items if the card does).
If the numbers still diverge after normalizing scope, that's worth a ticket — note the exact two surfaces and the values you see.
Exports and reports won't download
- Wait for generation. Large exports and PDF reports are built server-side and can take from seconds to a couple of minutes. The download appears when it's ready.
- Check pop-up and download blockers. A blocked pop-up or auto-download is the most common reason "nothing happens" after you click. Allow downloads for the ShadowMap domain.
- Re-generate if the link expired. Export and report download links are time-limited by design — an old link from a prior session may have expired. Generate a fresh one. See Data Retention for retention windows.
- Confirm your role can export. Some roles can view a module but not export it.
For how exports work end to end, see Exports.
Common questions
The whole dashboard is blank after a deploy. Is it down? Almost always no — it's a cached front-end build. Hard refresh (Ctrl/Cmd+Shift+R). If a private window loads fine, clear cache or disable extensions in your normal browser. If even a private window is blank, that's worth a ticket.
A module is completely missing from my sidebar. Where did it go? The sidebar only shows modules your role is permitted to see and that are enabled for your tenant. If a teammate sees a module you don't, it's a permissions difference, not a bug. Ask an administrator to review your role, or see Roles and Permissions.
I remediated a finding hours ago — why is it still showing? ShadowMap confirms fixes on re-scan, not in real time. The finding remains visible (often moved to a resolved/closed state) until the next scan reaches that asset and verifies the change. This is by design so you can audit what was fixed and when.
An asset I own isn't in ShadowMap at all. Did discovery miss it? Maybe — or it may be out of the scope your administrator defined, or a discovery scan hasn't reached it yet. The dedicated Missing Assets page walks through scope, discovery timing, filters, and how to add an asset to scope.
My 2FA code keeps getting rejected even though I'm typing it correctly. The most common cause is clock drift on the device running your authenticator app — time-based codes are only valid for a short window. Sync your phone's clock to network time and try again. For lockouts and resets, see Login and 2FA Issues.
Where do I report a bug versus ask a question? Use Report a Bug in the Support menu when the product is misbehaving — it lets you attach a screenshot, which dramatically speeds up diagnosis. Use Raise a Support Ticket for access, account, or data questions. Both reach the same team.
Can I get help if I can't log in at all? Yes. Email [email protected] directly — you don't need to be signed in. Include your account/tenant URL and the exact error so the team can act immediately.
Related
- Login and 2FA Issues — recover access, reset two-factor, and resolve lockouts.
- Missing Assets — why an asset isn't appearing and how to bring it into scope.
- Contacting Support — how to reach the team and what to include for a fast resolution.
- Roles and Permissions — what each role can see; explains most "missing module" reports.
- Your First Login — the sign-in flow, 2FA setup, and the dashboard you land on.
- Data Retention — how long findings, exports, reports, and sessions are kept.
- Exports — generating and downloading exports and reports.
- FAQ — answers to common product and account questions.