Getting Started
ShadowMap is an External Attack Surface Management (EASM) platform that continuously discovers your organization's internet-facing assets, monitors them for risk, and gives your team a single place to triage and remediate what it finds. This section is the recommended onboarding path: read it top to bottom and you'll go from "I just got an invite" to "I'm working my alert queue" without guessing.
If you want the high-level tour of what every module does, start at the documentation home. If you're ready to actually start using the product, you're in the right place.
Overview
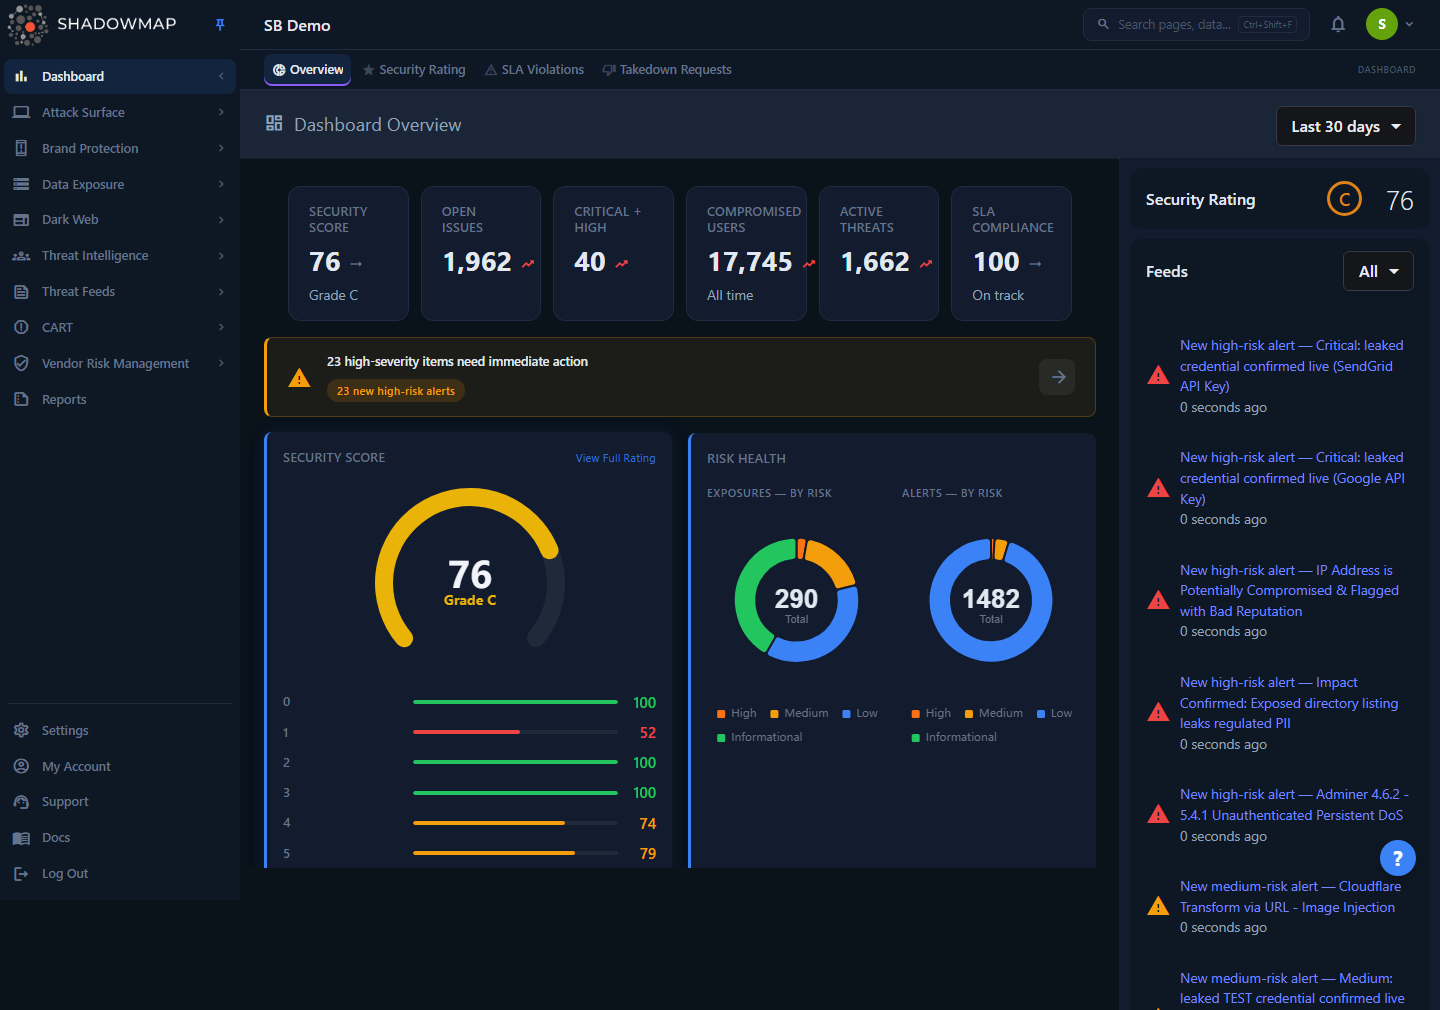
The Dashboard Overview at /dashboard/overview — the page ShadowMap drops you on after login. It summarizes your security rating, open risk, and recent activity across every module.
When you sign in, ShadowMap takes you straight to the Dashboard Overview. From there, the left sidebar exposes the modules your role is allowed to see, and a top bar carries universal search, notifications, and your account menu. Everything in these docs lives inside this web dashboard — there is no agent to install and nothing to deploy.
What you do first depends on what you are:
- A new user invited to an existing account — confirm your login and security, learn the layout, then go straight to Alerts.
- An administrator setting up the account — additionally configure members, roles, SLA policies, and integrations under Settings.
The four pages in this section, in order, cover both paths.
The onboarding path
Work through these in sequence. Each builds on the last.
| Step | Page | What you'll do |
|---|---|---|
| 1 | Your First Login | Sign in, set up two-factor authentication, and confirm your profile. |
| 2 | Navigating the Platform | Learn the sidebar, module groups, tabs, list/detail pattern, and global controls. |
| 3 | Roles and Permissions | Understand what your role lets you see and do, and why two users may see different menus. |
| 4 | Key Concepts | Learn the shared vocabulary — assets, findings, severity, status, and SLAs — that every module reuses. |
The 15-minute version
If you only do one thing: complete Your First Login, skim Key Concepts, then open Alerts. The alert queue is the fastest way to see what ShadowMap has already found about your organization and start acting on it.
How it works
These are the mechanics that apply across the whole platform — the things you can't infer by clicking around a single page during onboarding.
Discovery already happened before your first login
You do not upload an asset inventory or point a scanner at a target. By the time your account is provisioned, ShadowMap has been seeded with a small number of identifiers — your primary domain, your organization and brand names, key executives — and has expanded outward from there, resolving subdomains, related IP ranges, certificates, mobile apps, leaked data, and lookalike domains, and attributing each candidate back to your organization. So on day one the dashboard is already populated. Discovery then keeps running on a recurring cadence, so new exposures appear over time without anyone clicking "scan." If an asset you own is missing, see Missing Assets.
Login lands you on the Dashboard, not a setup wizard
There is no multi-step setup wizard to complete before you can use ShadowMap. Visiting the root URL redirects you to /dashboard/overview, and that is your home base. Onboarding is about learning the dashboard that's already there, not configuring one from scratch. Administrator setup (members, SLA policies, integrations) is optional refinement done later under Settings — it does not block anyone else from working.
Your menu is shaped by your role
ShadowMap uses role-based access control. There are four roles — Administrator, Analyst, SOC User, and Vendor — and the modules, actions, and settings you can reach are all permission-gated. Two people in the same account can legitimately see different sidebars: a missing module usually means your role doesn't grant it, not that the feature is broken or that data is missing. Administrators manage this under Members and Teams. The model is explained in Roles and Permissions and enumerated in RBAC and Permissions.
Almost everything is an "asset" or a "finding"
Two object types underpin the entire product, and recognizing them makes every module feel familiar:
- An asset is something attributed to you — a domain, subdomain, IP, web app, certificate, or mobile app. Assets live in Asset Inventory and the Attack Surface modules.
- A finding is an issue, exposure, or event tied to an asset — an open port, an expiring certificate, a phishing site, a leaked credential, a dark-web mention. Findings are what you triage.
Most module pages are filterable lists of findings (or assets), each with a detail view you open by clicking a row. The Key Concepts page covers this in full.
Severity and status are two independent axes
Every finding carries a severity (how bad it is — Critical, High, Medium, Low, Info) and a status (where it is in your workflow — Needs Review → Investigating → Accepted Risk → Closed). They move independently: a Critical finding moved to Accepted Risk is acknowledged but no longer demands action, while a Needs Review Low finding still sits in the queue. Internalizing this split early is the single highest-leverage thing for working efficiently. See Severity Levels and Status Workflow.
Prerequisites
Before you begin, make sure you have:
- An active ShadowMap account. Accounts are provisioned by your organization's administrator, who sends an email invitation. If you don't have one, ask your admin to add you under Members.
- A modern web browser. ShadowMap is a web application — current Chrome, Firefox, Edge, or Safari all work. Nothing to install.
- Your second factor ready. Set up two-factor authentication during your first login (see Your First Login). Have an authenticator app available.
- Knowing your role. What you can do depends on it. If you're unsure, ask your admin or check Roles and Permissions.
Administrators have extra setup
If you're configuring the account for your team, also plan to review Settings — at minimum Members, SLA Policies, and Integrations — after you've finished the four onboarding pages above.
Finding your way around
Once you're oriented, pick the entry point that matches what you're trying to do:
| If you want to… | Go to |
|---|---|
| Start your daily triage | Alerts |
| See your overall risk posture at a glance | Dashboard Overview |
| Quantify and trend your exposure | Security Rating |
| Review the assets ShadowMap attributes to you | Asset Inventory |
| Check for phishing sites or fake apps abusing your brand | Brand Monitoring |
| See dark-web mentions, breaches, and stealer logs | Dark Web Overview |
| Search every module at once | Universal Search |
| Pull data out for a report or ticketing system | Exports and Reports |
| Request removal of a phishing site or fake app | Takedown Requests |
| Connect ShadowMap to Slack, Teams, Jira, or a SIEM | Sharing and Integrations |
Common questions
Do I have to configure or "scan" anything before I see data? No. Discovery runs continuously from seed identifiers your account was set up with, so the dashboard is already populated when you first log in. Onboarding is about learning that dashboard, not building one. New findings keep arriving on their own.
Where does ShadowMap take me after I log in? To the Dashboard Overview (/dashboard/overview). The root URL redirects there. It's your home base and a good place to gauge posture before drilling into a module.
Where should I actually start working? Most teams start at the Alerts queue — it consolidates the noteworthy findings from across every module into one prioritized, deduplicated list. The Dashboard gives you the big picture; Alerts is where day-to-day triage happens.
Why does my colleague see modules or buttons I don't? Navigation and actions are permission-gated by role (Administrator, Analyst, SOC User, Vendor). If something is missing from your view, your role likely doesn't grant it. Ask an administrator and read Roles and Permissions.
Do I need to install an agent or open up my network? No. ShadowMap works entirely from the outside, the way an attacker would. You provide seed identifiers and it discovers the rest. Optional Cloud Sources can enrich discovery but are never required.
I'm an admin — what do I set up first? Add your team under Members and Teams, define your remediation clocks under SLA Policies, and wire up alerting via Integrations. Then point your analysts at this onboarding path.
An asset I own isn't showing up — what do I do? Attribution is automatic but deliberately conservative. Some assets need confirmation or a seed update. See Missing Assets.
I can't log in or my 2FA isn't working. See Login and 2FA Issues, then Contacting Support if you're still stuck.
Related
- Your First Login — step 1 of onboarding: sign in and secure your account.
- Navigating the Platform — step 2: the sidebar, module groups, and list/detail pattern.
- Roles and Permissions — step 3: what your role lets you see and do.
- Key Concepts — step 4: assets, findings, severity, status, and SLAs.
- Dashboard Overview — the post-login landing page that summarizes posture across all modules.
- Alerts — the consolidated, cross-module triage queue where most teams begin their day.
- Features — cross-cutting capabilities (search, tags, comments, exports, takedowns) that behave the same in every module.
- Troubleshooting — fixes for login, missing-asset, and other onboarding snags.