Alerts
Alerts is the single triage queue for your entire ShadowMap deployment. Every exposure a scanner finds — an open port, a weak certificate, a default credential, a leaked secret, a dark web mention — lands here as an alert with a risk level, a workflow state, and a full audit trail. This is where analysts spend most of their day: filtering down to what matters, dispositioning findings, and routing them to the right owner.
Overview
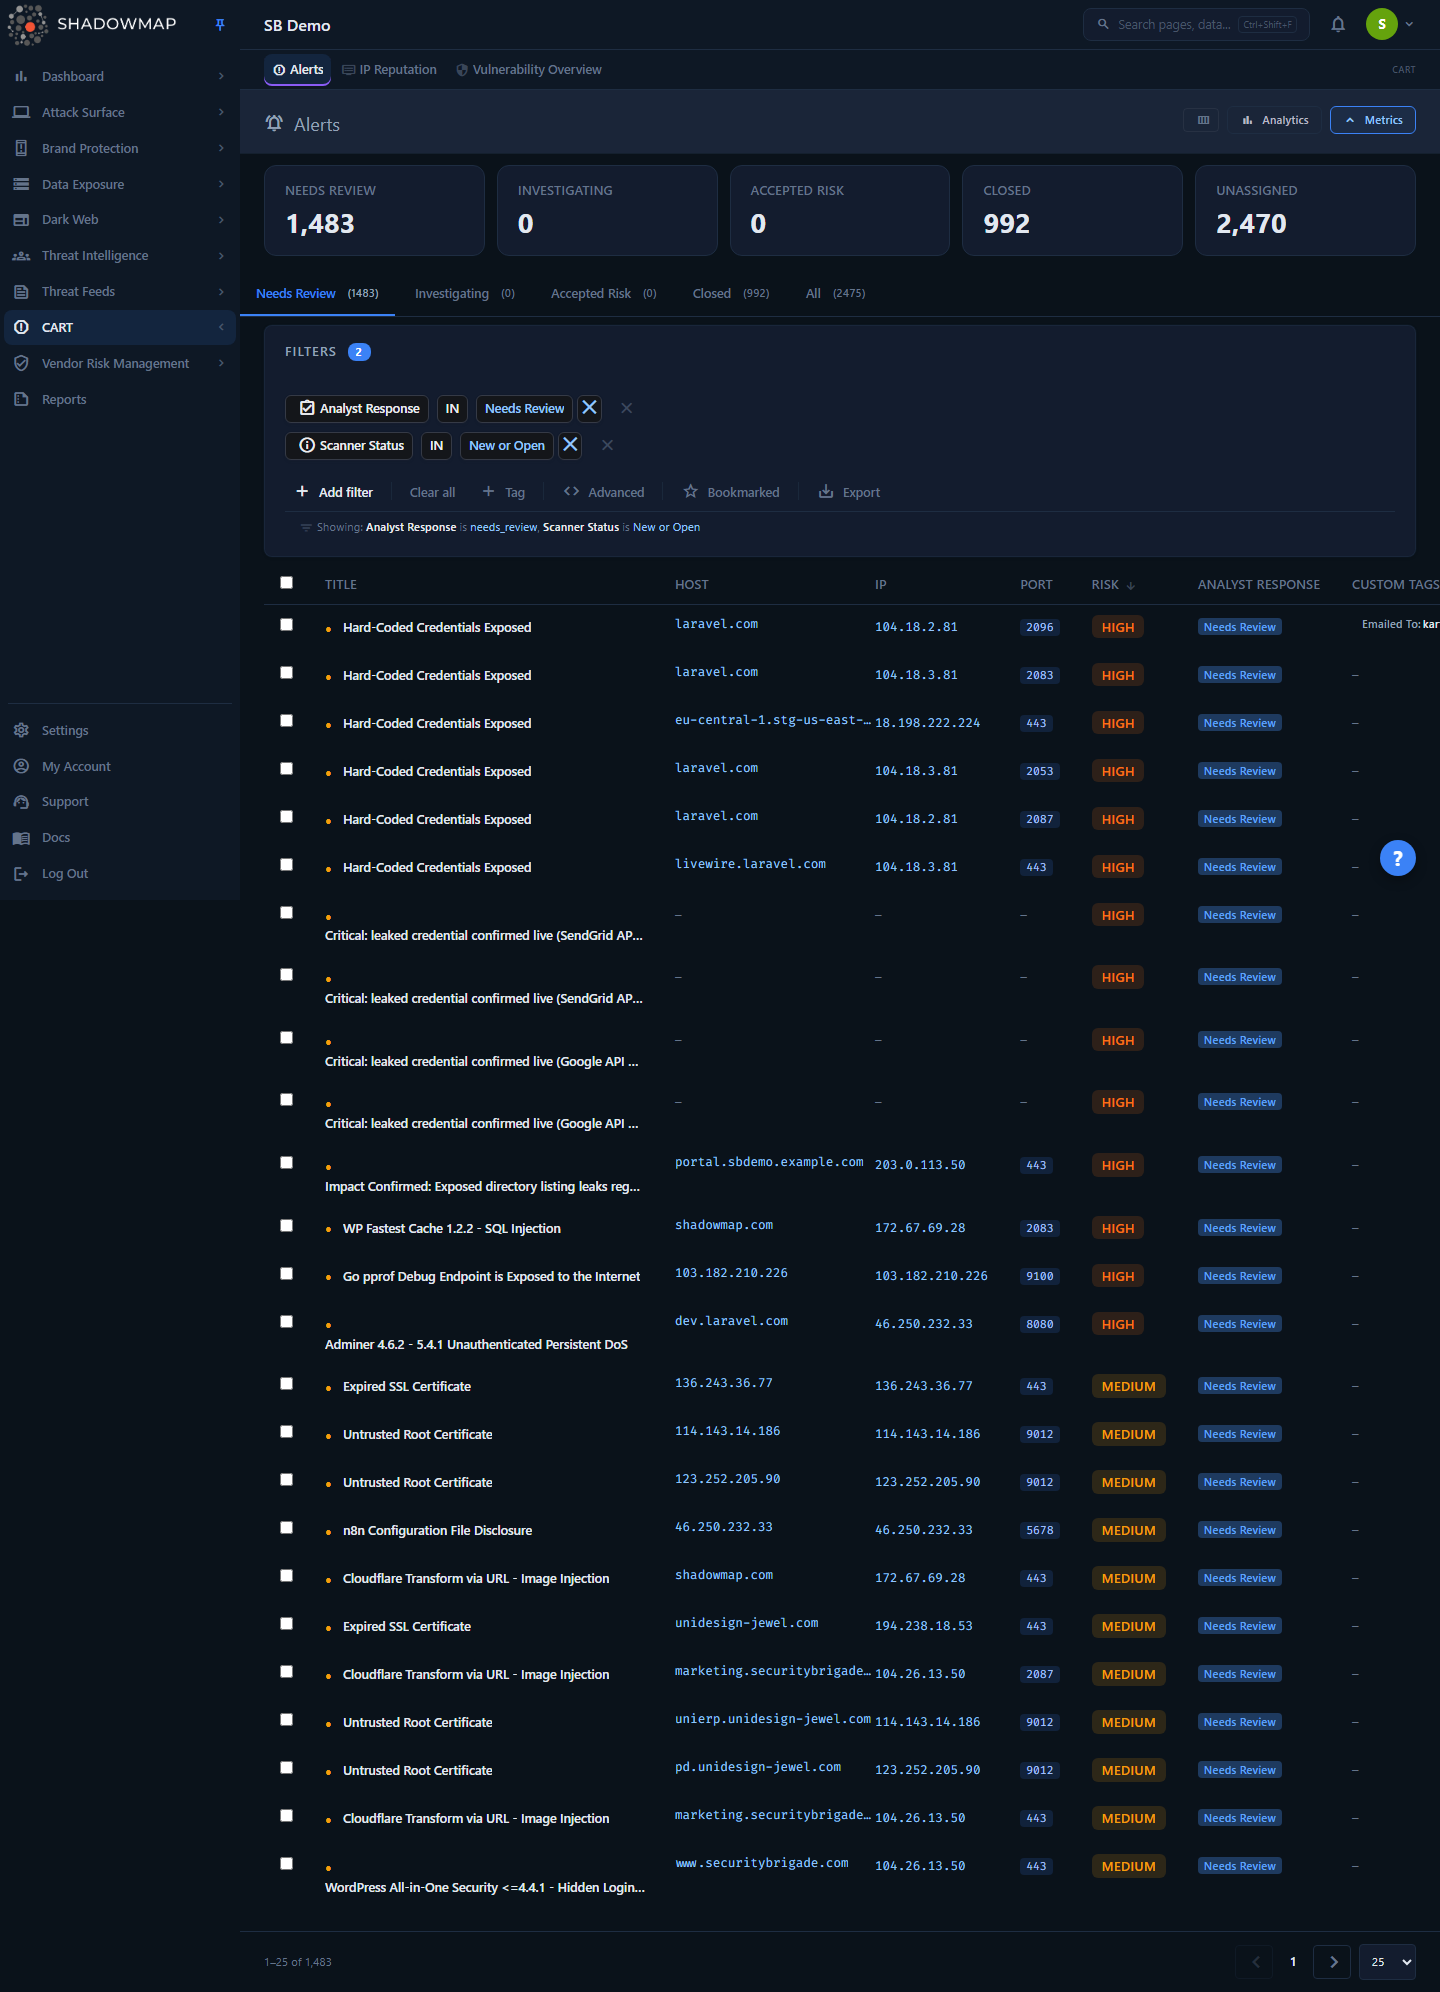
The page opens on the Needs Review tab — the queue of new, undispositioned findings. Working top to bottom you get:
- A metrics strip of five KPI cards (Needs Review, Investigating, Accepted Risk, Closed, Unassigned). The first four are clickable and jump you to the matching tab.
- A collapsible analytics panel with five charts: a 30-day new-vs-resolved trend, a risk-distribution donut, top affected hosts, geographic distribution, and a finding-type breakdown. Clicking a slice of the risk donut or a bar in Top Affected Hosts drops you into the list pre-filtered on that value.
- A tab bar that segments the queue by analyst response: Needs Review, Investigating, Accepted Risk, Closed, and All. Each tab shows a live count.
- A filter bar with 20 filter categories, a Bookmarked toggle, and Export.
- The alert table, with checkboxes for bulk actions, sortable columns, inline row actions, and a click-to-open detail drawer.
The two things to internalise before using the page: alerts carry two independent statuses (what the scanner sees vs. what your team decided), and the queue is deduplicated and reopened automatically, so the same exposure never clutters the list twice. Both are covered below.
How it works
These are the mechanics you cannot read off the screen.
Two status axes, never conflated
Every alert has two separate states, and the UI deliberately keeps them apart:
- Scanner Status — what ShadowMap's scanners currently observe.
New(just discovered),Open(still detected), orClosed(no longer detected in the latest scan). This is machine-driven and you do not set it. - Analyst Response — what your team decided.
Needs Review,Investigating,Accepted Risk, orClosed. This is the workflow axis you control.
The word "Closed" exists on both axes and means different things: a scanner-closed alert is simply gone from the latest scan; an analyst-closed alert is a human dispositioned it. To avoid the collision, the table demotes scanner status to a small dot next to the title — a filled dot (●) means Currently Detected, a hollow dot (○) means Not Detected in Latest Scan — and reserves the visible badges and tabs for the analyst-response axis. The KPI cards and tabs all count by analyst response, so a green "Closed" card reflects alerts your team closed, not alerts the scanner stopped seeing.
Why this matters
A finding can be scanner-Open and analyst-Accepted Risk at the same time (the exposure is real and ongoing, but you decided to live with it). It can also be scanner-Closed and analyst-Needs Review (the scanner no longer sees it, but nobody has confirmed the remediation). Keeping the axes separate is what lets you tell those apart.
Risk levels
Risk is derived from the finding's numeric risk score (CVSS-aligned). The thresholds are:
| Risk | Score | Meaning |
|---|---|---|
| High | 8.0 – 10.0 | Critical exposure; act immediately |
| Medium | 5.0 – 7.9 | Significant risk; address promptly |
| Low | 2.0 – 4.9 | Minor risk; address when convenient |
| Informational | 0.0 – 1.9 | Awareness only; no immediate action |
The table sorts by risk descending by default, so your highest-severity findings are at the top of Needs Review on first load.
Deduplication and auto-reopen
ShadowMap collapses repeat detections of the same exposure into one alert. The identity is a hash of the finding's join keys (IP + host + port + path + source + title). When a later scan re-detects the same exposure, ShadowMap updates the existing alert's Last Detected timestamp instead of creating a duplicate row.
If an alert was previously closed and the same exposure resurfaces in a new scan, it is reopened — the scanner status flips back to detected. A reopened alert almost always means the remediation was incomplete or the issue recurred.
How an alert is born
Alerts are not a separate scan; they are the normalised output of ShadowMap's full scanner fleet. Findings flow in from across the platform:
| Category | Example findings |
|---|---|
| Application | Web vulnerabilities, missing security headers, default credentials, exposed admin paths |
| Network | Open ports, zone transfers, anonymous FTP, RDP BlueKeep |
| SSL/TLS | Expired certificates, weak ciphers, protocol vulnerabilities |
| DNS / email | SPF/DKIM/DMARC issues, open resolvers, DNSSEC failures |
| Malware & reputation | Cryptominers, Safe Browsing hits, blacklisted IPs, honeypot detection |
Scanner names are intentionally hidden
The product does not expose third-party scanner source names in the filter UI. The customer-facing equivalent is the Finding Type taxonomy — use that filter to scope by the kind of finding instead.
The "Closed" tab counts a union
The Closed tab (and its KPI card) is the union of analyst-closed alerts and scanner-auto-closed alerts — anything a human closed plus anything the scanner stopped detecting. This is intentional: it answers "what is no longer an active concern?" rather than only "what did an analyst click close on." The other tabs (Needs Review, Investigating, Accepted Risk) scope to alerts the scanner still sees (New/Open).
SLA aging
The detail view tracks how long an alert has been open and flags it against SLA thresholds: past 30 days it reads as Aging — approaching SLA threshold, and past 90 days as Overdue — exceeds 90-day SLA threshold. When you configure SLA Policies, matching alerts are tracked against your own response-time targets and surface in SLA Violations when breached. Accepted Risk alerts are excluded from SLA tracking — that is the formal mechanism for "we know, we're keeping it."
Understanding the data
Each row in the table represents one deduplicated finding.
| Column | What it shows |
|---|---|
| Title | The finding's name, with the scanner-detection dot (●/○) beside it. Always visible. Click the row to open the detail drawer. |
| Host | The affected hostname; links into Subdomains (or IP Addresses if the "host" is a bare IP). |
| IP | The associated IP; links into IP Addresses. |
| Port | The service port; links into Open Ports filtered to that IP and port. |
| Path | The URL path of the finding, when applicable. |
| Risk | Severity badge (High / Medium / Low / Informational). Sortable. |
| Relevance | A relevance score badge for prioritisation. Sortable. |
| Scanner Status | New / Open / Closed badge (hidden by default; the title dot covers the common case). |
| Analyst Response | The workflow badge — Needs Review / Investigating / Accepted Risk / Closed. |
| Custom Tags | Your key:value tags applied to the alert. |
| Assigned | Initials of the assignee, if any. |
| First Seen | When the alert was first discovered, as relative time. Sortable. |
Sortable columns are Title, Host, Risk, Relevance, and First Seen. Use the column customizer in the page header to show or hide columns (Title is locked on); your selection persists across sessions.
Host, IP, and Port are pivots
The host, IP, and port cells are not just text — they link straight into the relevant asset surface, filtered to that value. From an alert you can jump to every other finding on that IP, the subdomain record, or the specific open port without re-searching. See Open Ports, IP Addresses, and Subdomains.
Filtering and search
The filter bar supports 20 categories. Filters compose with AND/OR conditions and persist in the URL, so a filtered view is shareable and bookmarkable.
| Filter | Scopes by |
|---|---|
| Alert Title | Text search across titles |
| Host / IP / Port / Path | The finding's location |
| CVE ID / CWE ID | Specific vulnerability or weakness identifier |
| Risk | Severity level |
| Scanner Status | New / Open / Closed |
| Analyst Response | Needs Review / Investigating / Accepted Risk / Closed |
| Assigned To | Owner |
| Country / ASN | Geolocation and network provider |
| Finding Type | The kind of finding (replaces scanner-name filtering) |
| Tag Rule | Automatically applied tag rules |
| SLA Policy Violation | Alerts breaching a specific SLA policy |
| EPSS Score | Exploit-prediction probability |
| Bookmarked | Alerts you starred |
| First Seen / Last Detected | Discovery and most-recent-detection date ranges |
| Custom Tags | Any user-defined key:value tag |
Two extra controls sit at the end of the filter bar:
- Bookmarked — a one-click star toggle that narrows the list to alerts you've bookmarked.
- Export — runs a background export of the currently filtered and sorted result set. You get exactly the subset you're looking at. See Exports.
Each tab also applies a preset filter (for example, Needs Review presets response = needs_review with the scanner still detecting it). You can layer your own filters on top of any tab.
Detail view
Clicking a row opens a drawer on the right; clicking the expand icon (or the row's "open full page") opens the full detail page at /threats/alerts/:id/details.
Drawer — fast triage without leaving the list:
- Risk, Scanner Status, and Analyst Response badges up top.
- One-click workflow buttons (Needs Review, Investigating, Accept Risk, Close) and Share.
- A Summary tab (host, IP, port, first seen, last detected, assignee) and a Context tab (tags, custom tags, an evidence/classification snapshot, and the proof-of-concept screenshot when available).
- Chevrons and the
j/kkeys move to the previous/next alert, paging across the list as needed, so you can triage a whole queue without re-clicking.Esccloses the drawer.
Full detail page — five tabs:
| Tab | Contents |
|---|---|
| Overview | The days-open SLA banner, the full metadata grid, Classification, Impact Analysis, the remediation guidance (description, impact, recommendation, and external references), Tags and Custom Tags, and the proof-of-concept screenshot. |
| Evidence & Remediation | The raw evidence/response data for the finding, rendered by a per-finding-type viewer (for example security headers, default-credential, RDP BlueKeep, or S3 bucket evidence). |
| Related Assets | Other applications on the same host (application, risk, status). |
| Activity & Comments | The History timeline (every disposition, assignment, and share, with who and when) plus the comment thread. Tag changes are bucketed separately so they don't drown the timeline. |
| Threat Intelligence | CVE context — CVSS score, severity, a Known Exploited (KEV) flag ("Yes — Active exploitation reported" when the CVE is on CISA's KEV list), and any associated threat actors and related campaigns. |
Taking action
On a single alert
From the drawer or the detail page you can set the Analyst Response (Needs Review → Investigating → Accept Risk → Close), assign it to a teammate, comment (with reusable comment templates), add custom tags, bookmark it, and share it by email or to a connected integration.
In bulk
Select rows with the checkboxes (or the header select-all for the page) and a bulk action bar appears:
- Needs Review / Investigating / Accept Risk / Close — set the response on every selected alert at once.
- Assign — pick a teammate from the popover and assign the whole selection.
- Bookmark, Share, and Tag — apply across the selection.
Selection resets on page change
Bulk selection is page-scoped. Changing page, page size, or paging the drawer clears the selection so a bulk action can never silently hit alerts you can't see. If a disposition update fails, the selection is kept intact so you can retry — failed actions are never swallowed silently.
Sharing and integrations
Alerts can be shared by email or pushed to a connected tool. The available destinations are Slack, PagerDuty, SIEM (Syslog), Jira Service Management, Jira Service Desk, and ServiceNow CMDB. Configure these under Integrations.
Common questions
Why did an alert get reopened? It was previously closed, but a later scan re-detected the same exposure (same IP + host + port + path + source + title). The scanner status flips back to detected. This usually means the remediation was incomplete or the issue recurred.
What's the difference between "Accepted Risk" and "Closed"?Closed means the exposure is remediated or no longer detected. Accepted Risk means the exposure still exists but your organisation made a deliberate decision to keep it (for example, a low-risk port that serves a real business purpose). Accepted Risk alerts are excluded from SLA-violation tracking.
The scanner dot is hollow but the analyst response still says Needs Review — what does that mean? The scanner no longer detects the exposure, but no analyst has confirmed it. The two axes are independent: a finding can drop off the scan before anyone reviews it. Confirm and close it, or leave it for the record.
Why don't I see the name of the scanner that found an alert? Third-party scanner source names are intentionally hidden. Filter by Finding Type instead — it's the customer-facing taxonomy for the kind of finding.
Why does the Closed tab count more than the alerts I closed? The Closed tab is the union of analyst-closed and scanner-auto-closed alerts. It answers "what is no longer active?", not only "what did an analyst close?"
How do I stop getting overwhelmed by volume? Work the tabs in order (Needs Review first), sort by Risk, and save filtered views as Saved Searches. Use Tag Rules to auto-categorise, SLA Policies to prioritise by severity and surface breaches, and assignment to distribute work. Route alerts into your existing tools via Integrations.
Related
- Open Ports — the network-exposure surface many alerts pivot into.
- Vulnerability Overview — a CVE-focused view of the vulnerabilities behind your alerts.
- IP Reputation — reputation scoring for your IP space, a sibling triage queue.
- SLA Violations — alerts that have breached your response-time targets.
- SLA Policies — configure the response-time targets and escalation that drive aging.
- Tag Rules — auto-apply tags to incoming alerts for routing and grouping.
- Integrations — push alerts to Slack, Jira, PagerDuty, and SIEM.
- Exports — how background exports of a filtered alert view work.