Report Center
Report Center is the archive of point-in-time reports ShadowMap produces after each scan of your external attack surface. Every completed scan becomes a row you can open, inspect, and download as a PDF or Excel artifact — the auditable, shareable snapshot that sits behind the live dashboard.
Overview
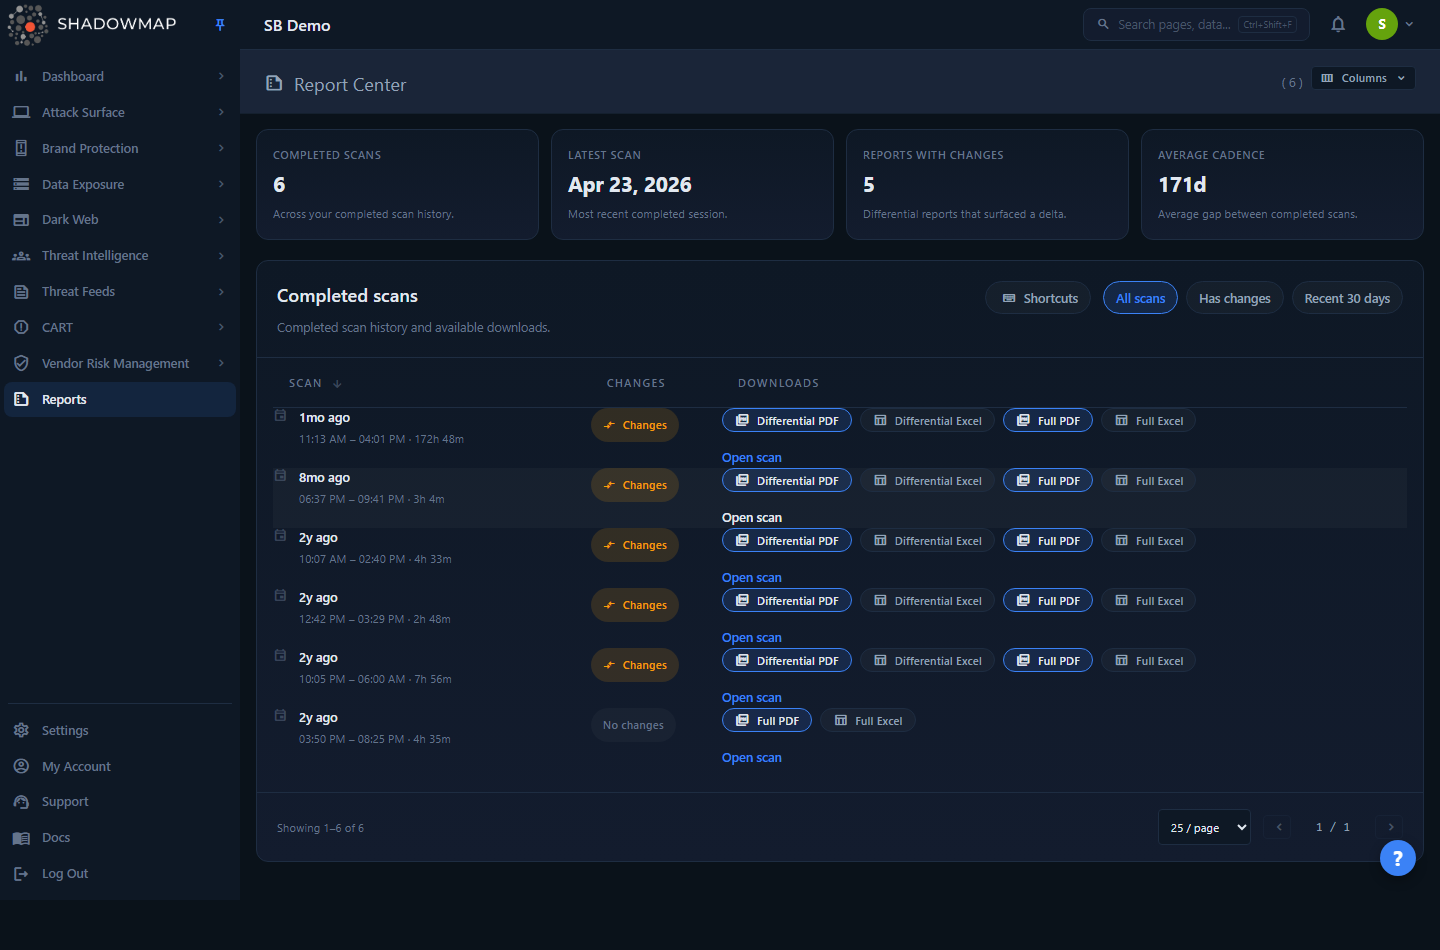
The page opens on /reports/all and is organized in three bands:
- Summary cards across the top — Completed scans, Latest scan, Reports with changes, and Average cadence — give an at-a-glance read on your scanning history.
- Completed scans table — one row per scan session, newest first, each with a change signal and the report files generated for that scan.
- Scope bar above the table —
All scans,Has changes,Recent 30 days— to narrow the list to what you care about right now.
Unlike the rest of ShadowMap, Report Center is not a queue of findings you triage. It is a download surface: the modules (Alerts, Open Ports, Web Applications, and the rest) are where you work the findings; Report Center is where you grab the formal, dated deliverable that captures the state of your surface at the moment a scan finished.
Who sees this page
Report Center requires the report.list read permission. Users without it do not see the Reports entry in navigation. See Roles and Permissions.
How it works
The mechanics below are not visible in the UI but determine exactly what you see and download.
A "scan session" is the unit, not a report
Each row is a scan session — one full run of the ShadowMap scanner against your assets, identified by a session ID, with a start time and (once finished) an end time. A session can carry several report files; the row groups them. The page lists only sessions that produced at least one customer-facing report, and vendor reports are always excluded — VRM artifacts live in Vendor Risk Management, not here.
Three report types
ShadowMap generates up to three kinds of report per scan. Which ones appear depends on your scan configuration and contract tier.
| Report type | What it is |
|---|---|
| Full | The complete state of your attack surface as of that scan — every asset, exposure, and finding the scan observed. The baseline snapshot. |
| Differential | The delta against the previous scan: what newly appeared, changed, or resolved. This is the report that drives the Changes signal (see below). |
| Daily Summary | A condensed recurring digest. Internally this is the "POC" report type; the UI relabels it Daily Summary everywhere it appears. Its Excel form is an 8-sheet workbook generated by a separate backend path. |
A single session commonly produces both a Full and a Differential report; the Daily Summary is a separate cadence on tenants that have it enabled.
How the "Changes" signal is computed
The Changes badge on a row — and the Reports with changes summary card — come exclusively from the Differential report's any_changes flag. When a differential scan finds a non-empty delta versus the prior scan, the flag is set and the row reads Changes; when nothing moved, it reads No changes. Full and Daily Summary reports never set this signal. This is why the Has changes scope filters specifically to sessions whose differential report flagged a delta — it is your fastest path to "show me only the scans where my surface actually moved."
Reports are pre-generated, not built on demand
ShadowMap renders these reports as part of the scan pipeline and stores the files in object storage. Report Center reads that archive — it does not generate a report when you open the page. The cadence between scans is therefore set by your scan schedule, not by anything you do here; the Average cadence card simply measures the mean gap (in days) between your completed sessions. New rows appear after each scan completes.
What "download" actually does
Clicking a download button does not stream a file directly. The button calls a report export endpoint, which produces a completed export log, after which the browser fetches that finished file from /exports/{logId}/download and saves it. Practically this means:
- A brief loading state (a spinning icon) on the button is normal while the export resolves.
- Large Full/Excel reports can take a few seconds.
- The downloaded filename follows the pattern
reporttype_reportid.pdfor.xlsx.
PDF and Excel are produced by different backends. Excel for a Daily Summary report routes through a dedicated workbook generator distinct from the Full/Differential Excel path — the UI picks the right one for you automatically.
PDF availability
A PDF button only appears for a report when ShadowMap actually rendered and stored a PDF for it. Excel is always offered. If you see only an Excel button on a report, no PDF was generated for that artifact.
Understanding the table
The table is deliberately lean — three columns, two of which are locked on.
| Column | What it shows | Notes |
|---|---|---|
| Scan | When the scan ran, as a relative time ("3d ago") with the exact start–end time range and duration on the secondary line. | Hover for the absolute calendar date. Sortable. Locked on. |
| Changes | Changes (with a delta icon) or No changes, from the differential report. | Can be hidden via the Columns customizer. |
| Downloads | The report files for that scan, each rendered as a labelled download button (for example Full PDF, Differential Excel, Daily Summary Excel), plus an Open scan link to the detail view. | Locked on. |
The Columns control (top-right of the page header) lets you hide the Changes column for an even quieter, download-only view. Scan and Downloads are locked and cannot be hidden. Your choice is remembered in the browser.
Summary cards
The four cards read straight from your scan history: Completed scans (lifetime count of sessions that finished), Latest scan (date of the most recent completed session), Reports with changes (count of differential reports that surfaced a delta), and Average cadence (mean days between completed scans). A value of – means there isn't enough history yet to compute it.
Filtering and sorting
- Scope bar — three quick views over the same data:
- All scans — every session with a report.
- Has changes — only sessions whose differential report flagged a delta.
- Recent 30 days — sessions started within the last 30 days.
- Sort — click the Scan column header to toggle ascending/descending by scan date.
- Pagination — 25 / 50 / 100 rows per page, with page controls at the bottom and a live "Showing X–Y of N" count.
Keyboard shortcuts
Press ? to open the shortcut help. 1 jumps to All scans, 2 to Has changes, 3 to Recent 30 days. Shortcuts are ignored while you are typing in a field.
Scan session detail
Click any row (or Open scan) to open /reports/:id/details, a focused view of one scan session. It shows:
- Session header — the scan date, session ID ("Session #..."), scan duration, and report count. If an earlier completed session exists, a Previous link with its date lets you walk backward through your scan history.
- Available Downloads — one card per report, each tagged with a colored type badge (Full / Differential / Daily Summary) and a Changes detected marker when the differential found a delta. PDF (when available) and Excel buttons sit on each card.
- Scan Timeline — a vertical timeline: Scan Started, Scan Completed (when an end time was recorded), and a Generated entry for each report, with its generation timestamp.
The detail view is the cleanest place to grab every artifact for a single scan and to confirm exactly when each report was produced.
Common questions
Where are my vendor reports? They are intentionally excluded from Report Center. Vendor risk artifacts live under Vendor Risk Management.
Why does one scan show multiple reports? A single scan session typically produces a Full report and a Differential report, and may also produce a Daily Summary. They are grouped under one row because they all describe the same scan.
What is the difference between Full and Differential? Full is the complete snapshot of your surface at scan time. Differential is only what changed since the previous scan. Use Full for a point-in-time inventory or audit; use Differential to brief stakeholders on what moved.
The Changes column says "No changes" — did the scan run? Yes. "No changes" means the differential report found no delta versus the prior scan, which is the normal, healthy state for a stable surface. The scan still ran and a fresh Full report was still produced.
A download button is spinning for a while — is it broken? No. Downloads resolve an export on the backend before the file is fetched, so a short delay (longer for large Full/Excel reports) is expected. Let it finish rather than clicking repeatedly.
Why is there only an Excel button on some reports, no PDF? ShadowMap only renders a PDF for some report artifacts. When no PDF was generated, only the Excel download is offered. Excel is always available.
How often do new reports appear? On every completed scan. The cadence is set by your scan schedule, not by this page; the Average cadence card shows your historical mean gap between scans.
Can I generate a report for a custom date range here? No. Report Center serves the reports ShadowMap already produced per scan. For ad-hoc, filtered data pulls from a specific module, use that module's export instead — see Exports.
Related
- Exports — on-demand CSV/Excel exports scoped to a single module's current view, as opposed to the full pre-generated scan reports here.
- Vendor Risk Management — where vendor (VRM) reports live; they are deliberately excluded from Report Center.
- Executive Dashboards — the live, in-app rollup of the same posture these reports capture as static snapshots.
- Security Rating — the score and trend that the reports document at each scan.
- Activity — the running log of changes across your surface, complementary to the per-scan Differential reports.