Elasticsearch Instances
Elasticsearch Instances surfaces Elasticsearch (and Elasticsearch-compatible) clusters that ShadowMap found exposed on the public internet and attributed to your organization. Each row is one reachable instance — IP, port, the indices it exposes, how many documents sit in them, and the server fingerprint — so you can confirm the exposure and shut it down before someone scrapes it.
An unauthenticated Elasticsearch node is one of the highest-impact data-leak classes on the attack surface: the REST API will happily return whole indices to any client that can reach the port. This module is your queue for finding those nodes, deciding which are yours, and tracking them to closure.
Overview
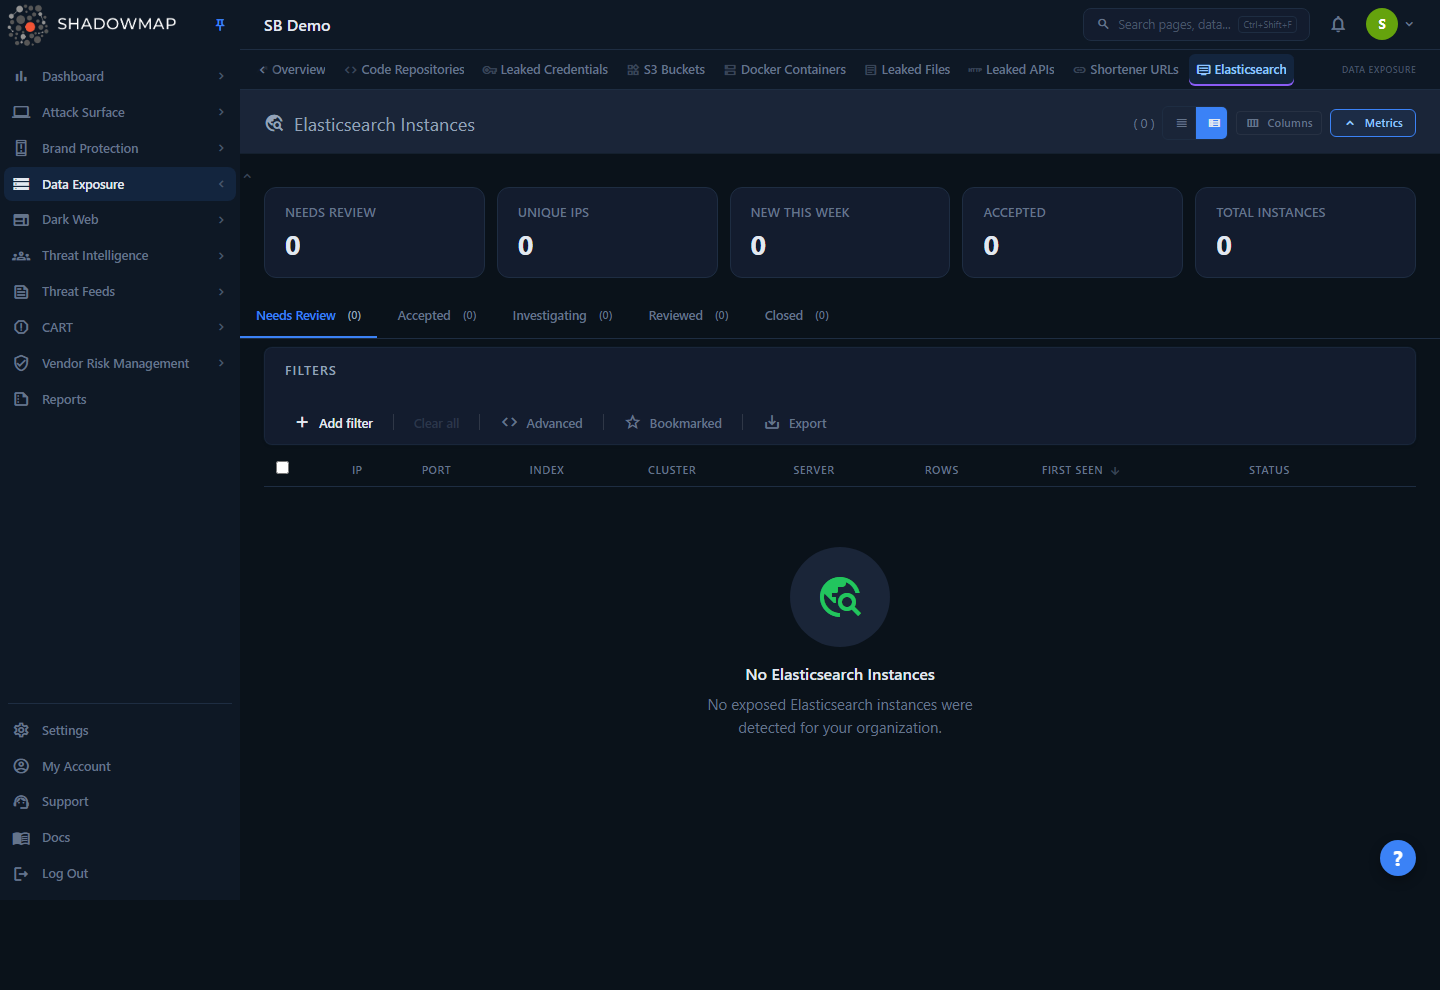
The page is a triage workbench, not a static report. At the top, a metrics strip summarizes posture (Needs Review, Unique IPs, New This Week, Accepted, Total). Below it, status tabs split the queue by workflow state, and the main table lists every instance with sortable columns. Selecting one or more rows reveals a bulk action bar; clicking a row opens a detail drawer with the full field set and per-instance status controls.
You reach it at Data Leaks → Elasticsearch Instances (/data-leaks/elastic-search-instances). The module requires the data-leaks.elastic-search-instances permission; users without it will not see the menu entry.
Why this is in Data Leaks
An exposed Elasticsearch node is treated as a data-leak surface rather than a generic open port because the finding carries the contents indicator — index names and document counts — that tell you whether real data is sitting behind the open port. The related Open Databases and Elasticsearch as a network service on Open Ports views look at the same class of exposure from the database and port angles.
How it works
These are the mechanics you cannot infer from the table alone.
How instances are discovered
ShadowMap continuously fingerprints the IP addresses and hosts it has attributed to your organization (see IP Addresses and Domains). When a service on a discovered host answers like an Elasticsearch REST API, the scanner records the instance and, where the node permits it, reads cluster metadata from the API:
- The cluster name, cluster UUID, and version are read from the cluster metadata the node returns.
- The index name and document count (
row_count) come from the index stats the node returns without authentication.
A high row_count against a recognizable index name is the strongest signal that real data is exposed — the node answered a metadata request from an unauthenticated client, which usually means it will answer a data request too.
Instances, IPs, and ports
Each row is one observed instance, carrying a single IP, port, index, and document count (row_count). One IP can therefore appear on more than one row — for example a host listening on the default 9200 and on an alternate port shows as two rows.
The Unique IPs metric counts distinct IP addresses among the un-triaged online instances (the Needs Review set), which is usually lower than Total Instances. Use Unique IPs when you are reporting roughly how many hosts still need review, and Total Instances when you are reporting the size of the whole queue across every state.
First seen vs. last seen
- First Seen is when ShadowMap first observed this IP:port answering as Elasticsearch. It does not change.
- Last Seen is the most recent scan in which the instance was still reachable. A Last Seen that stops advancing is the signal that the node has gone offline or been firewalled — confirm before you close it, because a node that is merely down may come back.
Status vs. response status (two independent fields)
Every instance carries two state fields, and the UI blends them into one badge, which trips people up:
- status is your triage workflow position: Needs Review (0), Accepted (1), Investigating (2), Closed (3). You move an instance through these as you work it.
- response_status is whether the finding is real: Online (0) or False Positive (1). Marking an instance Reviewed sets
response_status = False Positive— it tells ShadowMap "this is not a genuine exposed instance of ours," surfaces it in the Reviewed tab, and removes it from the Needs Review queue (which only shows online findings). Its underlying workflowstatusis left unchanged.
The status badge you see in the table is the response status when it is set to false positive (shown as Reviewed), otherwise the workflow status. So an instance you mark Reviewed shows "Reviewed" regardless of its underlying workflow status. See Severity & Status and Status Workflow for the platform-wide model.
SLA tracking
Elasticsearch Instances is SLA type 27. If your organization has an SLA policy scoped to this module, instances accrue a violation when they sit unresolved past the policy's threshold. Violations are surfaced in SLA Violations and configured under SLA Policies.
Understanding the data
Columns
The table is column-customizable. IP is always shown and cannot be hidden; most other columns are toggled from the column customizer in the page header. Defaults are marked below.
| Column | Default | Description |
|---|---|---|
| IP | Always on | The instance's IP address. Primary identifier; cannot be hidden. |
| Port | On | The listening port. 9200 is the Elasticsearch default; alternate ports are common on proxied or containerized nodes. |
| Index | On | The index name recorded for the instance. A meaningful name (e.g. customers, logs-prod) is a strong "this is real data" signal. |
| Cluster | On | The cluster name reported by the node. Often left at the Elasticsearch default elasticsearch; a custom name aids attribution. |
| Server | On | The server name fingerprint, where the node reports one. |
| Rows | On | Document count (row_count) in the exposed index. The headline impact number — how many records are reachable. |
| Version | Off | The Elasticsearch version string. Old versions (e.g. pre-7.x) frequently have known unauthenticated-access CVEs. |
| Relevance | On | A computed 0–100 priority badge. Shown by default and sortable; it is not listed in the column customizer, so it cannot be hidden from there. |
| First Seen | On | When ShadowMap first observed the instance. |
| Last Seen | Off | Most recent scan in which the instance was still reachable. |
| Status | Always on | The blended workflow/response badge (see Status workflow below). |
Surface the impact columns on screen
When you are reviewing the queue, turn on Version and Last Seen alongside the defaults: Rows quantifies blast radius, Version flags exploitability, and Last Seen proves whether the exposure is still live. Note that the file export uses a fixed column set (IP, Port, Index, Row Count, Cluster Name, Server Name, First Seen, Last Seen) and does not follow your on-screen column choices — Version, for example, is not included in the export.
Status tabs and the workflow
The status tabs above the table partition the queue. Each tab shows a live count.
| Tab | What it contains | Underlying condition |
|---|---|---|
| Needs Review | New, un-triaged instances that are still online | status = Needs Review AND response_status = Online |
| Accepted | Instances you have acknowledged as a real, known exposure | status = Accepted |
| Investigating | Instances under active investigation | status = Investigating |
| Reviewed | Instances you marked as not genuinely yours / false positive | response_status = False Positive |
| Closed | Instances you have resolved (taken down or confirmed gone) | status = Closed |
New findings land in Needs Review. From there you either accept them (real exposure to be worked), move them to investigating, mark them reviewed (not a genuine finding), or close them once resolved. The selected tab is reflected in the URL (/data-leaks/elastic-search-instances/<tab>), so a link you copy or a page you reload lands on the same sub-view.
Metrics strip
| Metric | Meaning |
|---|---|
| Needs Review | Count of un-triaged online instances (status = Needs Review and response_status = Online). Clickable — jumps to the Needs Review tab. |
| Unique IPs | Distinct IP addresses among the un-triaged online (Needs Review) instances. Not clickable. |
| New This Week | Un-triaged online instances first seen in the last 7 days. A red up-arrow means more than the prior 7 days (worse); green down means fewer (better). Not clickable. |
| Accepted | Count in the Accepted state. Clickable — jumps to the Accepted tab. |
| Total Instances | All instances across every state. Not clickable. |
Filtering & search
A free-text search box matches across IP, port, index, cluster name, and server name. Wildcard characters (%, _) in the search term are treated literally.
Structured filters let you narrow by specific field values, combined with AND logic:
| Filter | Type |
|---|---|
| IP Address | Multi-select from observed values |
| Port | Multi-select |
| Cluster Name | Multi-select |
| Server Name | Multi-select |
| Version | Multi-select |
| First Seen Date | Date range (start/end on first_seen_on) |
Multi-select options are populated from the distinct values actually present in your data, so you only ever filter on real ports, versions, and cluster names that exist on your surface.
Two additional toggles sit next to the filters:
- Bookmarked — limit the list to instances you have starred. Bookmark any row with the star icon; bookmarks are per-user.
- Export — generate an export of the current view (see Taking action).
Find the dangerous nodes fast
Filter Version to an old major (e.g. anything pre-7.x) and sort by Rows descending. That puts the highest-document-count, most-likely-exploitable nodes at the top of the queue.
Detail view
Click any row to open the detail drawer. It shows the full field set for the instance:
- IP Address and Port (also shown as the drawer title,
ip:port) - Index, Row Count
- Cluster Name, Server Name, Cluster UUID, Version
- First Seen, Last Seen
The drawer is the only place the Cluster UUID is shown — useful when correlating the same logical cluster across multiple IPs. Use the ‹ / › arrows in the drawer header to page through instances without closing it.
The Status section in the drawer gives you one-click status changes for the instance: Needs Review, Accepted, Investigating, Reviewed, Closed. The current state's button is hidden, so the buttons shown are always the moves available from where the instance is now.
Taking action
Per-instance
From the detail drawer, set the instance to any workflow state, or mark it Reviewed (false positive). Star the row to bookmark it for your own follow-up.
Bulk actions
Select rows with the checkboxes (or Select all in the header), and the bulk action bar appears at the bottom. The buttons offered depend on the active tab — the state the instances are already in is omitted:
| Action | Effect |
|---|---|
| Needs Review | Move selected instances back to Needs Review |
| Accept | Mark as a real, acknowledged exposure (Accepted) |
| Investigate | Move to Investigating |
| Reviewed | Mark as false positive (Reviewed) |
| Close | Resolve the instances (Closed) |
| Assign | Assign to a team or user; filter the list of assignees inline, or Clear Assignee |
| Share | Push the selection to a connected integration (e.g. ticketing) |
Verify before you close
"Closed" should mean the node is genuinely no longer reachable or has been authenticated/firewalled. Because Last Seen only advances when a scan confirms reachability, closing an instance whose Last Seen merely went stale can hide a node that is intermittently down and will reappear. Confirm the port is actually shut before closing.
Export
The Export button (next to the filters) produces a downloadable file of the current view. The export respects your active tab, filters, search term, and sort, so the set of rows matches what is on screen — scope the list first, then export. The exported columns are a fixed set (IP, Port, Index, Row Count, Cluster Name, Server Name, First Seen, Last Seen) and do not depend on which columns you have toggled on. See Exports for formats and delivery.
Other workbench controls
- Compact / expanded view toggle in the header changes row density.
- Column customizer shows/hides columns (IP is locked on).
- Comments can be added per instance from the comment icon on each row, with reusable comment templates.
- Keyboard triage:
j/kmove between rows,Enteropens the drawer,Spaceselects,sbookmarks,Esccloses the drawer,?shows the shortcut overlay.
Common questions
Is ShadowMap downloading data from these clusters? No. ShadowMap reads the cluster metadata the node returns to an unauthenticated client — index names, document counts, version, cluster UUID — to evidence the exposure. It does not pull index contents. The document count tells you how much would be reachable to an attacker who did.
Why does an instance show as "Reviewed" instead of its workflow status? "Reviewed" is the response-status state (false positive). Once you mark an instance Reviewed, that takes visual precedence over the workflow status in the table badge, and the row moves to the Reviewed tab. To put it back into active triage, set it to Needs Review, Accepted, or Investigating.
What's the difference between Reviewed and Closed? Reviewed = "this is not a genuine exposed instance of ours" (a false positive — wrong attribution, a honeypot, a decoy, or not actually open). Closed = "this was a real exposure and we've resolved it" (the node was secured, authenticated, or taken offline). Keep them distinct so your Closed count reflects real remediation, not noise.
Why is Unique IPs lower than Total Instances? They measure different populations. Total Instances is every row across every workflow state, while Unique IPs counts only the distinct IPs among the un-triaged online (Needs Review) instances — and one IP can appear on several rows when it exposes more than one port. Report whichever matches the question you're answering.
An instance disappeared from Needs Review — where did it go? Either someone changed its status (check the Accepted/Investigating/Reviewed/Closed tabs) or it stopped responding and was triaged out. Its First Seen/Last Seen still tell you the exposure window; an export of all tabs will show every instance regardless of state.
Do alerts fire for new exposed Elasticsearch instances? New findings in this module follow your platform alerting and SLA configuration. Configure delivery in Alert Preferences; SLA thresholds for this module (type 27) are set in SLA Policies and breaches appear in SLA Violations.
Related
- Open Databases — the same exposed-datastore class for other database engines; pair with this view for full database-exposure coverage.
- Open Ports — the network-service angle on the same hosts; an Elasticsearch instance here corresponds to an open
9200-class port there. - Data Leaks Overview — module-level rollup of every data-leak surface, including Elasticsearch exposure.
- Leaked Files — exposed file stores, the document-leak counterpart to these exposed index stores.
- SLA Violations — where overdue Elasticsearch findings surface against your policy.
- Severity & Status and Status Workflow — the platform-wide triage model these tabs implement.