Network Services
Network Services rolls up every product and version ShadowMap has fingerprinted on your internet-facing assets into one inventory — one row per distinct technology, not one row per host. It answers the question "what software is running on my perimeter, and where is the risky stuff?" without making you pivot through thousands of individual open ports.
Overview
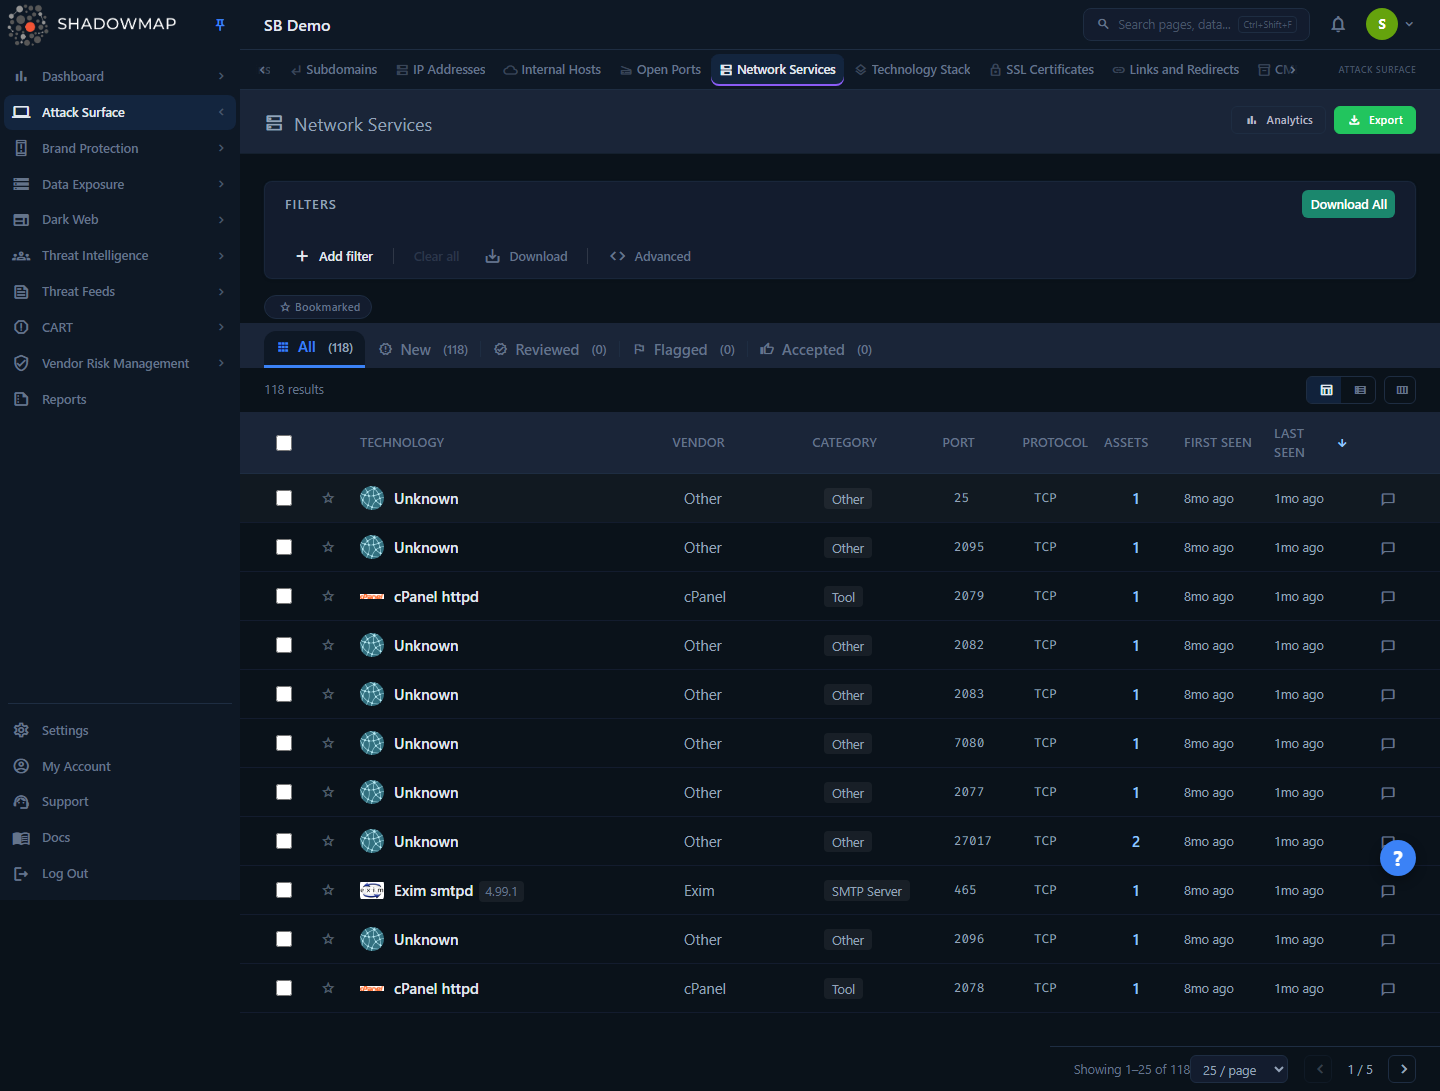
The list at /threats/network-services/all shows the technologies ShadowMap detected across your external infrastructure. Each row is a product + version + port + protocol combination — for example nginx 1.18.0 / 443 / tcp — with a count of how many of your assets run it. A collapsible analytics panel above the table provides KPIs and charts; below it sit the search filters, workflow status tabs, and the technology table itself.
This module is built on the same scan data as Open Ports, but inverts the view: Open Ports is host-centric (one row per IP/port), while Network Services is technology-centric (one row per software product). Use Network Services to reason about software exposure and patch posture; use Open Ports to reason about individual hosts.
Where the data comes from
Network Services is derived from your open-port scan results (summarized_open_ports). Only ports with status open are counted, and CDN-fronted entries are excluded so the inventory reflects software you actually run, not edge infrastructure. A row only appears once ShadowMap has fingerprinted a product on at least one open port.
How it works
Most of what makes this module useful happens server-side and is not obvious from the table alone.
Grouping and uniqueness
Every raw open port that carries product fingerprint data is grouped into a single service row by a canonical identity hash:
MD5( product || version || port || protocol )This product_hash is the spine of the whole module. The list, the workflow tab counts, the detail page, and the export all resolve against the exact same grouped identity — so a status you set or a number you see never drifts between views. Two assets running OpenSSH 8.9p1 on 22/tcp collapse into one row with an Assets count of 2; the same OpenSSH build on a different port is a separate row, because the port is part of the identity.
The Assets count is a COUNT(DISTINCT ip) — it tells you the blast radius of that technology across your estate, not the number of port records.
Risk classification
Every service row is automatically assigned a risk level (critical / high / medium / low / info) by a rule-based classifier. The rules are evaluated in order and the first match wins:
| Level | Triggers | Score |
|---|---|---|
| Critical | Service exposed on a port that should never face the internet — 23 (Telnet), 445 (SMB), 135/137/138/139 (RPC/NetBIOS), 512/513/514 (rexec/rlogin/rsh) — or a service/product name matching telnet, ftp, rlogin, rexec, rsh, vnc, rdp, smb, netbios | 90–95 |
| High | Sensitive service on a database/admin/remote-access port — 21 (FTP), 3389 (RDP), 5900–5902 (VNC), 1433 (MSSQL), 1521 (Oracle), 3306 (MySQL), 5432 (PostgreSQL), 6379 (Redis), 27017/27018 (MongoDB), 9200/9300 (Elasticsearch), 5000 (Docker Registry), 2049 (NFS), 111 (rpcbind), 161 (SNMP), 389 (LDAP), 873 (rsync), 11211 (Memcached) — or a known end-of-life product version | 70–75 |
| Medium | Product in a Database or Cache category on a non-flagged port | 50 |
| Low | A standard service with a detected version string | 20 |
| Info | A standard service with no specific risk indicators | 10 |
End-of-life detection
The classifier carries a built-in EOL table for common server software (Apache ≤2.2, nginx ≤1.9, OpenSSH 4–6.x, PHP ≤7.4, MySQL ≤5.5, PostgreSQL ≤9.5, IIS ≤7.5, Tomcat ≤7, Node.js ≤14, Python 2.x, OpenSSL ≤1.0, and more). A product/version match here forces the row to High even on an otherwise unremarkable port — these are the unpatched legacy installs worth hunting first.
The detail page layers a second, deployment-aware signal on top: it flags services that have been running for 1+ years (long-running services often lack recent patches) and services found on more than 10 assets (large blast radius). These context alerts surface as advisory banners — "Long-running Service" and "Wide Deployment" — in the Risk Assessment card, alongside the classifier's risk badge.
Relevance score
The Relevance column shows a computed prioritization score, not a field from the database. It is calculated per row after the query runs and is intended to float the services most worth your attention to the top when you sort by it. Because it is computed rather than stored, sorting by Relevance ranks the full result set in memory before paginating.
Service age signals
The detail view and version comparison flag aging infrastructure: a service not updated in 90+ days is marked for review, and 180+ days is treated as likely-abandoned infrastructure. First Seen is the earliest scan that observed the technology; Last Seen is the most recent — a stale Last Seen on an open service is a strong "forgotten box" indicator.
Understanding the data
Table columns
The flat table view shows the following columns. All except Technology can be toggled via the column customizer (the view_column icon in the toolbar); your selection is remembered in the browser.
| Column | What it shows |
|---|---|
| Technology | Product name, detected version (as a chip), and vendor favicon. Always visible. |
| Vendor | The parent vendor/organization behind the product (e.g. "Apache Software Foundation"). Falls back to Other when unknown. |
| Category | Product category (Web Server, Database, Cache, etc.). Falls back to Other. |
| Port | The port the service was fingerprinted on. |
| Protocol | tcp / udp. |
| Assets | Distinct IPs running this exact service. Click it to jump to the matching hosts in Open Ports. |
| First Seen | When ShadowMap first observed this technology, shown as a relative time. |
| Last Seen | Most recent observation, shown as a relative time. |
| Relevance | Computed prioritization badge (see How it works). |
Workflow status
Every service carries a review status, surfaced as tabs above the table. Status is tracked per company against the service's identity hash, so it persists across scans as long as the technology stays the same.
| Status | Meaning |
|---|---|
| New | Default. Not yet triaged. Includes anything never actioned. |
| Reviewed | An analyst has looked at it and confirmed it's understood. |
| Flagged | Marked for follow-up — something needs action or investigation. |
| Accepted | Risk acknowledged and accepted; expected to remain. |
The All tab shows everything; the other four tabs filter to their status and show live counts in the tab badge.
View modes
A toggle in the toolbar switches between two layouts of the same data:
- Table view — the flat, sortable, paginated list. Click any column header to sort; click again to flip direction.
- Grouped view — services collapsed under their vendor, with per-vendor service counts and total asset counts, ordered by blast radius. Useful for "how much of my surface is Microsoft / Apache / Oracle?"
Filtering & search
The filter bar supports structured queries across these fields:
| Field | Notes |
|---|---|
| Product / Version | The fingerprinted software and its version string. |
| Category / Vendor | Product taxonomy and parent organization. |
| Port / Protocol / Service | Transport-level identity. |
| IP Address / Hostname | Narrow to a specific asset. |
| Country / ASN / Provider | Geographic and hosting-provider scoping. |
| Port Status | Open ports only is the default scope of the module. |
| CPE / Banner | Match the raw CPE identifier or the service banner text. |
| First Seen / Last Seen | Date-range filters for finding new or stale services. |
Custom tags you define elsewhere in ShadowMap also become filterable fields here. Filter option lists (e.g. all distinct categories or vendors) are loaded on demand and capped to the top 100 values by frequency.
Metric cards are filters
Clicking a KPI card in the analytics strip applies the matching filter instantly — New This Week filters to services first seen in the last 7 days, Exposed Databases filters to the Database category, and Top Category filters to your single largest category. Click the active card again to clear it.
You can also restrict the table to bookmarked services using the Bookmarked chip below the filter bar. Bookmarks are personal and toggled with the star icon on each row.
The analytics panel
The collapsible panel above the table (toggled from the page header; its open/closed state is remembered) provides a posture overview.
KPI strip — six cards:
| Card | What it measures |
|---|---|
| Total Services | Count of distinct grouped services in scope. |
| Unique Products | Distinct product names, regardless of version. |
| New This Week | Services first seen in the last 7 days, with a week-over-week delta. A rising number is flagged as a negative trend. |
| Exposed Databases | Services whose category is Database or Cache — the ones that should rarely be internet-facing. |
| Top Category | Your largest software category by service count. |
| Categories | Number of distinct categories present. |
Charts:
- 30-Day Service Trend — cumulative service count over the last month.
- Category Distribution — donut of services by category.
- Geographic Distribution — assets by country (top 15).
- Top Ports — the 15 most common ports; high-risk ports are highlighted in red.
- Top Vendors — the 10 vendors contributing the most distinct services.
Detail view
Clicking a row opens the service detail page (/threats/network-services/{productHash}/detail). A four-card summary strip shows Asset Count, Port/Protocol, First Seen, and Last Seen, followed by three tabs:
- Overview — Product Information grid (vendor, category, protocol, service, CPE), a Risk Assessment card with the risk badge plus context banners for long-running and wide-deployment services, and Banner Analysis showing the raw captured service banner.
- Assets — paginated table of every IP running this exact service: IP, port, hostname, country, provider, and last seen. Each IP links into Open Ports pre-filtered to that host and port.
- Versions — every version of this product observed across your infrastructure, each as a card with its own risk badge, asset count, age, and first/last seen. When 3 or more versions are present, a Version Sprawl warning appears — a signal that the same software is being maintained inconsistently and some instances are likely unpatched.
From the detail header you can set the service's status directly with the Review, Flag, and Accept buttons.
Taking action
You triage services from the list using bulk selection or from the detail page individually.
- Select one or more rows with the checkboxes (or Select all in the header).
- The bulk action bar appears. From it you can:
- Mark Reviewed, Flag, or Accept the selection.
- Assign to a team member, or Clear the current assignee.
- Share the selection to a connected integration.
- Counts on the workflow tabs update immediately.
Other actions available per row: bookmark (star), open the detail page (click the row), jump to the underlying hosts in Open Ports (click the Assets count), and add comments (with optional saved comment templates).
Keyboard triage
The list supports keyboard-driven review. Press ? to see the overlay:
| Key | Action |
|---|---|
j / ↓ | Next row |
k / ↑ | Previous row |
Enter | Open detail |
Space | Toggle selection |
s | Toggle bookmark |
Esc | Close drawer |
Export
The Export button generates an Excel report as a background job; it honors your current filters, status tab, and sort order, so the export matches exactly what you're looking at.
Common questions
Why does one technology show fewer rows than I have hosts? Rows are grouped by product + version + port + protocol, not by host. The Assets count tells you how many distinct IPs share that exact service. If the same product appears on different ports or in different versions, those are separate rows.
Why don't I see closed ports here? By design. Network Services scopes to open ports only — software behind a closed port isn't currently exposed. Use Open Ports if you need the full port history including closed/filtered states.
Are the risk levels driven by actual CVEs? No. The risk classification here is a fast, rule-based heuristic over port exposure, service type, and end-of-life version data — it surfaces suspicious exposure without waiting for vulnerability correlation. For confirmed CVEs tied to detected technology, see Vulnerability Overview and CVE Feeds.
My CDN/edge endpoints aren't showing up — is that a bug? No. CDN-fronted entries are deliberately excluded so the inventory reflects software you operate rather than shared edge infrastructure.
How is this different from Technology Stack?Technology Stack focuses on the technologies detected on your web applications (frameworks, CMSes, JS libraries, analytics). Network Services focuses on services exposed on open network ports (databases, SSH, web servers, remote-access protocols) across all IPs. They overlap on web servers but answer different questions.
Does setting a status close anything elsewhere? No. Network Services status (Reviewed/Flagged/Accepted) is a triage state local to this module's inventory. It doesn't open or close Alerts.
Related
- Open Ports — the host-centric source data; click any Assets count to land here pre-filtered.
- Technology Stack — web-application technology fingerprinting, the application-layer companion to this module.
- Vulnerability Overview — known CVEs correlated to your detected technologies, the next step after spotting a risky service.
- CVE Feeds — the CVE intelligence stream behind vulnerability correlation.
- Alerts — where actionable, prioritized findings across modules are managed.