Security Rating
The Security Rating distills your entire external attack surface into one number. It is a 0–100 score with an A–F letter grade, computed as the equal-weighted average of eight category scores — Vulnerability Management, Network Security, Application Security, Encryption & Certificates, Email & DNS Security, Dark Web & Threat Intelligence, Data Exposure, and Brand Protection. It is the metric a CISO quotes to the board, and the same number every other module rolls up into.
Overview
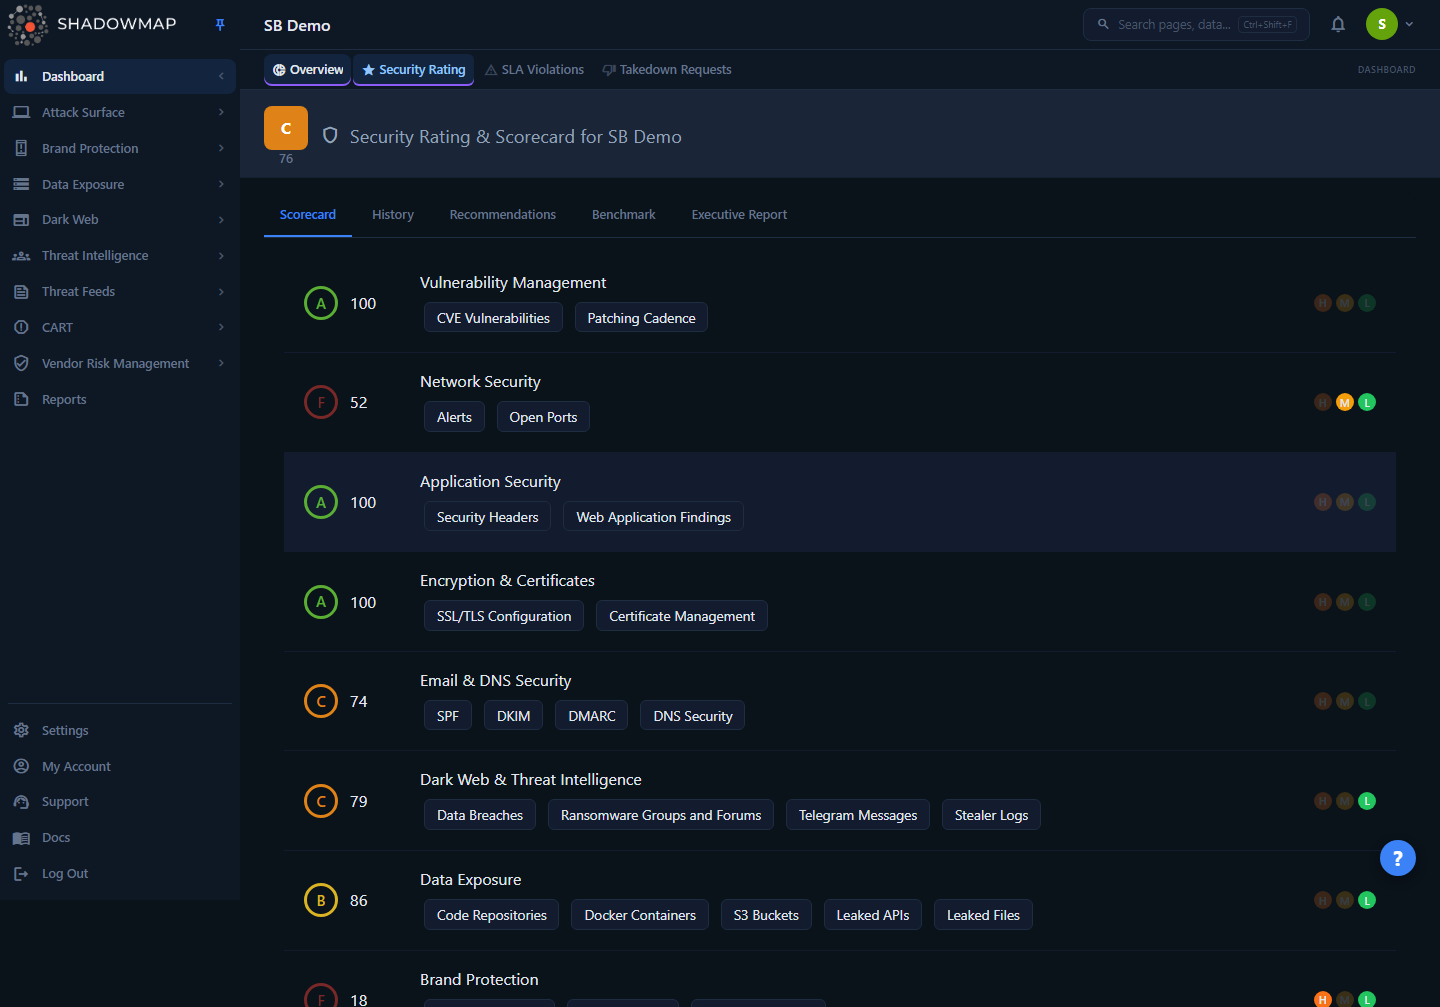
The page header shows your current overall score and grade, alongside the page title and organization name. Below it is a tab strip with five views:
| Tab | What it shows |
|---|---|
| Scorecard | Current score and grade for each of the eight categories, with the contributing factors and a high/medium/low risk summary per category. This is the default landing tab. |
| History | 7-day Risk Trend (finding counts) and Score Trend (daily average score) charts, with week-by-week navigation. |
| Recommendations | A prioritized, impact-ranked list of actions to raise your score, with a one-click jump to the underlying findings. |
| Benchmark | Compare your overall score and per-category breakdown against up to five peer organizations. Hidden for vendor-role users. |
| Executive Report | A formatted, print/PDF-ready posture report covering the score, category breakdown, top risks, and a projected score. |
Where the score comes from
The Security Rating is not a separate scan. It is a derived rollup of findings you already see in the individual modules (Alerts, Open Ports, SSL Certificates, Data Breaches, Phishing, Code Repositories, and so on). Fixing a finding in its own module is what moves this number.
How it works
The mechanics below are not visible in the UI but determine exactly what your number means.
Eight categories, equal weight
ShadowMap scores eight security domains independently, each on its own 0–100 scale. Your overall score is the simple average of the eight category scores, rounded to the nearest whole number — every category is weighted equally. There is no hidden weighting that favors one domain over another.
Worked example:
| Category | Score |
|---|---|
| Vulnerability Management | 85 |
| Network Security | 90 |
| Application Security | 72 |
| Encryption & Certificates | 88 |
| Email & DNS Security | 91 |
| Dark Web & Threat Intelligence | 78 |
| Data Exposure | 82 |
| Brand Protection | 84 |
| Overall | 84 |
Because the categories are averaged equally, a single category sitting at an F drags the overall down by roughly the same amount no matter which category it is. That is intentional — it stops a strong perimeter from masking, say, a wide-open dark-web exposure.
How each category score is calculated
Each category score (0–100) is driven by the number and severity of open findings in that domain:
- Fewer open findings → higher score.
- Critical and high-severity findings move the score far more than medium or low findings. A handful of critical issues can outweigh dozens of low ones.
- Only open findings count. Findings you have closed, marked as accepted risk, or marked as false positive in their source module stop dragging the score down once the next recalculation runs.
The per-finding counts that feed each category are assembled from the live module data — for example, Network Security combines open high-risk alerts with open high-risk ports, and Data Exposure sums open findings across code repositories, Docker containers, S3 buckets, leaked APIs, and leaked files. Dark Web & Threat Intelligence treats every stealer-log finding as high severity by design, because it represents an active endpoint compromise.
Externally visible findings only
The rating is built entirely from what ShadowMap can see from the outside — the attacker's perspective. Internal controls, compensating controls, and remediation that is not externally observable will not move the score.
Recalculation cadence
Scores recalculate automatically whenever new scan results arrive, typically every few hours (scans for different surfaces complete on different schedules). The score you see reflects the most recent calculation.
The get endpoint is cached server-side for 10 minutes per company, so a remediation you just completed may take up to 10 minutes — plus the time for the next scan and recalculation — to show up here. The score is computed once on the server and shared by every consumer (this page, the dashboard gauge, reports), so all surfaces always show the same number.
Grade bands
The letter grade is a fixed banding of the numeric score and is applied identically to the overall score and to each category:
| Grade | Score range | Color |
|---|---|---|
| A | 90 – 100 | Green |
| B | 80 – 89 | Gold |
| C | 70 – 79 | Orange |
| D | 60 – 69 | Red |
| F | 0 – 59 | Dark red |
The eight categories
Each category monitors a specific slice of your external attack surface. The factor chips shown on the Scorecard name the exact modules that feed the score — and most of them are clickable, taking you straight to the underlying findings list.
| Category | What it measures | Feeds from | Improve it by |
|---|---|---|---|
| Vulnerability Management | Known vulnerabilities in exposed infrastructure | CVE findings, open alerts by severity, open-port risk, patching cadence | Patching critical/high CVEs (KEV catalog first), closing risky ports |
| Network Security | Security of network-facing infrastructure | Open ports, exposed services, open alerts by severity | Closing unnecessary ports, hardening service configurations |
| Application Security | Posture of your web applications | Web application findings, security-header issues, misconfigurations | Fixing misconfigurations, adding security headers, resolving web-app findings |
| Encryption & Certificates | SSL/TLS configuration and certificate health | SSL/TLS configuration, certificate management and expiry | Renewing expiring certificates, disabling weak TLS (1.0/1.1), fixing chain issues |
| Email & DNS Security | Email and DNS security configuration | SPF, DKIM, DMARC, DNS security posture | Enforcing DMARC, fixing SPF records, enabling DNSSEC |
| Dark Web & Threat Intelligence | Exposure on the dark web | Data breaches, ransomware groups & forum discussions, Telegram messages, stealer logs, executive credential leaks | Forcing password resets for breached accounts, investigating dark-web mentions, actioning stealer-log findings |
| Data Exposure | Leaked data across public sources | Code repositories, Docker containers, S3 buckets, leaked APIs, leaked files | Removing exposed repos, securing buckets, revoking leaked keys, remediating container exposures |
| Brand Protection | Brand abuse and impersonation | Phishing URLs, fake mobile applications, domain squatting | Requesting takedowns for phishing, reporting fake apps, monitoring squatted domains |
Email & DNS factors are reference-only
SPF, DKIM, DMARC, and DNS-security factors are scored, but they do not yet have a dedicated list module — so their chips on the Scorecard are plain text rather than links. Every other factor chip links to its findings list.
Reading the Scorecard
Each category appears as a row on the Scorecard tab with these elements:
- Grade badge — the color-coded A–F letter for that category.
- Score — the numeric 0–100 score for the category.
- Category name — which domain the row covers.
- Factor chips — the specific data sources feeding the score (e.g. "CVE Vulnerabilities", "Patching Cadence", "Open Ports", "S3 Buckets"). Clickable chips deep-link to that module's findings list, pre-filtered to the relevant tab (e.g. "Alerts" lands on the Needs Review queue).
- Risk indicators — three dots labelled H / M / L showing whether there are High (orange), Medium (amber), or Low (green) open findings in that category. A dimmed dot means no findings at that severity. Hover a dot to see the exact count (e.g. "High risk: 12 issues"); an empty dot reads "High risk: No issues".
History tab
Two charts show how your posture has moved, defaulting to a 7-day daily window:
- Risk Trend (line chart) — daily counts of High, Medium, and Low findings. Use it to spot a spike (a new scan surfaced issues), a steady decline (remediation is working), or a stubborn flat-high line (a chronic unaddressed issue).
- Score Trend (bar chart) — your daily average score, with each bar color-coded by its grade band. Use it to confirm a remediation actually moved the number and to correlate score changes with specific dates.
Use the previous / next arrows to page back and forward through weeks. The "next" arrow is disabled once you reach the latest available date.
Recommendations tab
ShadowMap generates a ranked, data-driven action list rather than generic advice. Each recommendation card shows:
| Field | Meaning |
|---|---|
| Priority | Ranking order; 1 is the most impactful. Cards are sorted by priority. |
| Title | What needs to be fixed. |
| Description | Context and detail. |
| Severity | Critical, High, Medium, or Low — shown as a colored dot, and it also tints the priority number. |
| Estimated score impact | How many points your overall score could rise if you resolve it (shown as a +N pts badge and a relative impact bar). |
| Affected count | Number of assets/findings impacted. |
| Category | Which category the recommendation rolls up to. |
The summary bar at the top tallies how many Critical / High / Medium recommendations are open. On hover, each card reveals a "View findings" action (opens the underlying findings in a new tab, when a link is available) and a Dismiss action.
Recommendation statuses: the backend recognizes Open (default), In Progress, Resolved, and Dismissed, but the only status change you can make from this panel is Dismiss. Dismissing a recommendation removes it from the active list — use it for accepted risk or items that don't apply. Only open recommendations are shown here (up to 20), ordered by priority.
Work top-down by impact
Sort your effort by Estimated Score Impact, not by severity alone. Resolving a single high-impact recommendation can lift the overall score by several points, whereas clearing many low-impact items barely moves it.
Benchmark tab
Compare your overall score and per-category breakdown against up to five peer organizations, ranked highest-to-lowest by overall score. Your own organization is highlighted and labelled "Your Organization", and each peer row carries a per-category bar breakdown.
To add a peer:
- Click Add Customer (the select control on the Benchmark toolbar).
- Pick an organization from the dropdown.
- Their score and breakdown appear alongside yours, re-ranked.
To remove a peer, click the × on their chip. If the organization you want isn't listed, use Request Customer — set a priority (High/Medium/Low), enter the name and optional tags, and submit the request to the ShadowMap team.
Benchmarks reflect external posture only
Peer scores come from ShadowMap's external scanning of those organizations. They represent externally visible posture, not the peer's internal security controls. The Benchmark tab is hidden for vendor-role users.
Executive Report tab
A board-ready, formatted report rendered from your current scores. It includes the overall score circle, a per-category breakdown with bars, the Top Risks (your top recommendations), a Score Projection ("if top 5 resolved" → projected score), and a data-coverage note. Click Export PDF to open a clean print view you can save or hand to leadership.
Common questions
My score dropped suddenly. Why? The score recalculates when new scan data arrives, so a drop almost always means new open findings: a fresh scan surfaced issues, a certificate that was expiring has now expired, new leaked credentials or code were discovered, or a newly published breach includes your organization. Open the category that fell on the Scorecard and click its factor chips to see exactly which new findings landed there. The History tab's Risk Trend will pinpoint the day the spike happened.
How often does the score update? Automatically, whenever new scan results come in — typically every few hours. There is also a 10-minute server-side cache, so a change can take up to ~10 minutes (plus scan/recalculation time) to appear.
I fixed findings but my score hasn't moved. Two things have to happen: the finding must be closed in its own module (or marked accepted risk / false positive), and a recalculation must run against the new state. If you've just closed items, wait for the next scan cycle and the cache to expire. Until then the score still reflects the prior open count.
Why is my score different from what I expected? The rating is built only from externally visible findings — the same view an attacker has. Internal controls, segmentation, WAFs you haven't surfaced, and any remediation that isn't observable from outside won't be reflected here.
One category is an F but everything else is fine — why is my overall so low? The overall score is the equal-weighted average of all eight categories. A single F (0–59) pulls roughly an eighth of the way down regardless of which category it is. Open that category and work its highest-impact recommendations first.
Can I dispute a finding that's hurting my score? Yes — but not from this page. Go to the finding in its own module (Alerts, Data Exposure, Phishing, etc.) and mark it as Accepted Risk or False Positive there. Once it's no longer an open finding, the next recalculation removes its drag on the score.
Related
- How the Score is Calculated — deeper detail on category scoring, averaging, and grade bands.
- Improving Your Score — a prioritized remediation playbook (quick wins → medium-term → ongoing).
- Benchmarking — comparing against peer organizations in depth.
- Dashboard Overview — the landing page that surfaces this score as a gauge alongside open risk and recent findings.
- Alerts — the finding queue that feeds Network Security and Vulnerability Management; close items here to move those category scores.
- SLA Violations — response-time compliance, a companion view of how quickly you remediate the findings behind the score.