Data Exposure Overview
The Data Exposure module is the central hub for monitoring sensitive information belonging to your organization that has been exposed on the internet. It aggregates findings from code repositories, cloud storage, paste sites, public registries, URL shorteners, and breach databases into a single operational dashboard.
Overview Dashboard
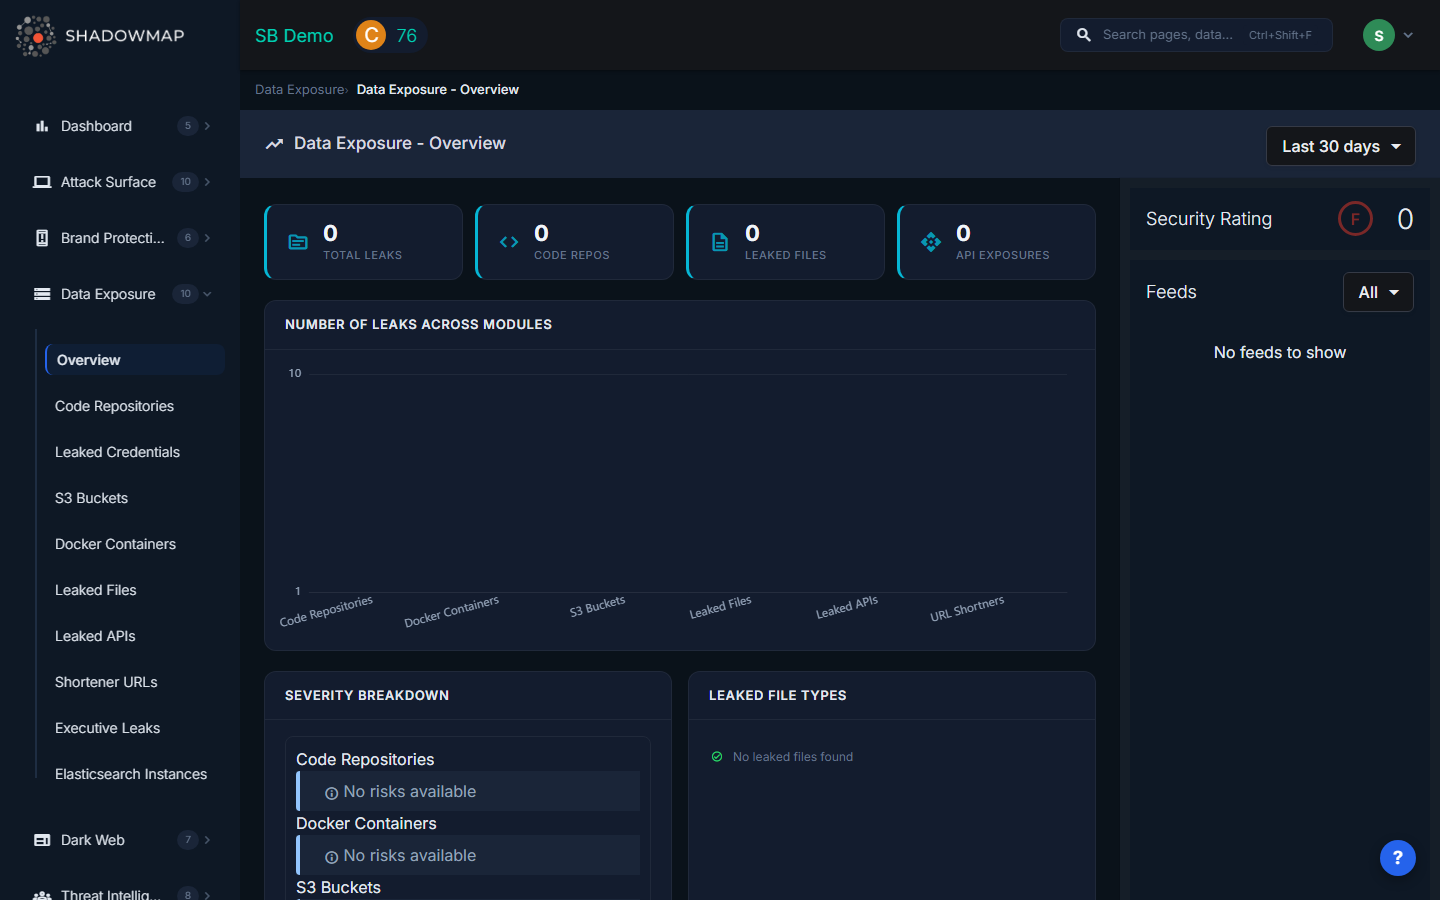
When you open Data Exposure, the overview dashboard presents a consolidated view of your organization's data exposure posture. A date range selector in the top-right corner lets you scope all widgets to Today, Last 7 days, Last 30 days, This Year, or Till Today (all time). Changing this filter refreshes every widget on the page simultaneously.
Hero Metrics Strip
Four hero metric cards span the top of the dashboard, each showing a real-time count:
| Metric | Icon | What It Counts |
|---|---|---|
| Total Leaks | source | Sum of all findings across every Data Exposure sub-module |
| Code Repos | code | Repositories on GitHub, GitLab, or Bitea containing your organization's sensitive data |
| Leaked Files | description | Sensitive documents detected on malware analysis platforms and public file-sharing services |
| API Exposures | api | Exposed API endpoints, keys, or tokens discovered on public sources |
These counts update dynamically when you change the date range filter.
Number of Leaks Across Modules (Bar Chart)
Below the hero strip, a horizontal bar chart visualizes the count of findings per sub-module: Code Repositories, Docker Containers, S3 Buckets, Leaked Files, Leaked APIs, and URL Shorteners. The Y-axis uses a logarithmic scale so modules with vastly different finding volumes remain visually comparable. Clicking any bar navigates directly to that sub-module's listing page.
Severity Breakdown
The left card in the second row displays a severity breakdown grouped by sub-module. Each module shows its distribution across Critical, High, Medium, Low, and Informational risk levels using color-coded risk cards. This lets you quickly identify which exposure categories carry the highest risk and need immediate attention.
Leaked File Types (Donut Chart)
The right card shows a donut chart breaking down leaked files by parent file type (e.g., CSV, JSON, XML, SQL, ENV, PEM/KEY). Below the chart, a Threat Level badge strip shows how many files fall into each threat classification: Malicious, Suspicious, Ambiguous, No Verdict, No Specific Threat, and Not Available.
Top Leaked API Sub-domains
A table listing the sub-domains with the highest number of exposed API endpoints. Each row shows the sub-domain name and an exposure count badge. This helps prioritize which parts of your infrastructure have the most API exposure.
Top URL Shortener Sub-domains
A companion table showing which of your organization's sub-domains appear most frequently in URL shortener services (bit.ly, tinyurl, etc.). High counts indicate internal resources that employees are inadvertently sharing via public shortening services.
Activity Feed
A right-side panel streams recent activity across all Data Exposure sub-modules in chronological order. The feed supports infinite scroll pagination and can be filtered by module type (Code Repositories, S3 Buckets, Docker Containers, Leaked Files, Leaked APIs, URL Shorteners). Each feed entry shows the finding title, module, timestamp, and risk level.
Security Rating
The overview also displays the Data Leaks module security rating score derived from ShadowMap's Security Rating engine. This score reflects how your data exposure posture contributes to (or detracts from) your organization's overall security rating.
Sub-Modules
| Module | Description |
|---|---|
| Code Repositories | Sensitive data found in public GitHub, GitLab, and Bitea repositories |
| Leaked Credentials | Employee credentials found in breach databases and paste sites |
| S3 Buckets | Publicly accessible AWS S3 buckets belonging to your organization |
| Docker Containers | Exposed Docker registries and container images |
| Leaked Files | Sensitive documents and files found on public sources |
| Leaked APIs | API keys and endpoints exposed in public code or configuration |
| Shortener URLs | Internal URLs exposed through URL shortening services |
| Executive Leaks | Personal data of executives exposed in breaches |
| Elasticsearch Instances | Publicly accessible Elasticsearch databases |
How Data Exposure Affects Your Security Rating
Data exposure findings directly impact your ShadowMap Security Rating. Critical and high-severity findings (such as plaintext credentials in public repositories or exposed S3 buckets with write access) produce the largest rating penalties. Resolving findings, marking them as false positives, or completing takedowns restores rating points. The score-by-module breakdown on the overview shows exactly how much this module contributes to your overall rating.