SLA Violations
SLA Violations is the accountability layer for your attack surface. It watches the findings that matter to you — defined by an SLA policy — and raises a tracked violation the moment a qualifying issue goes unresolved, then escalates it on a schedule and notifies the right people until someone closes it.
Overview
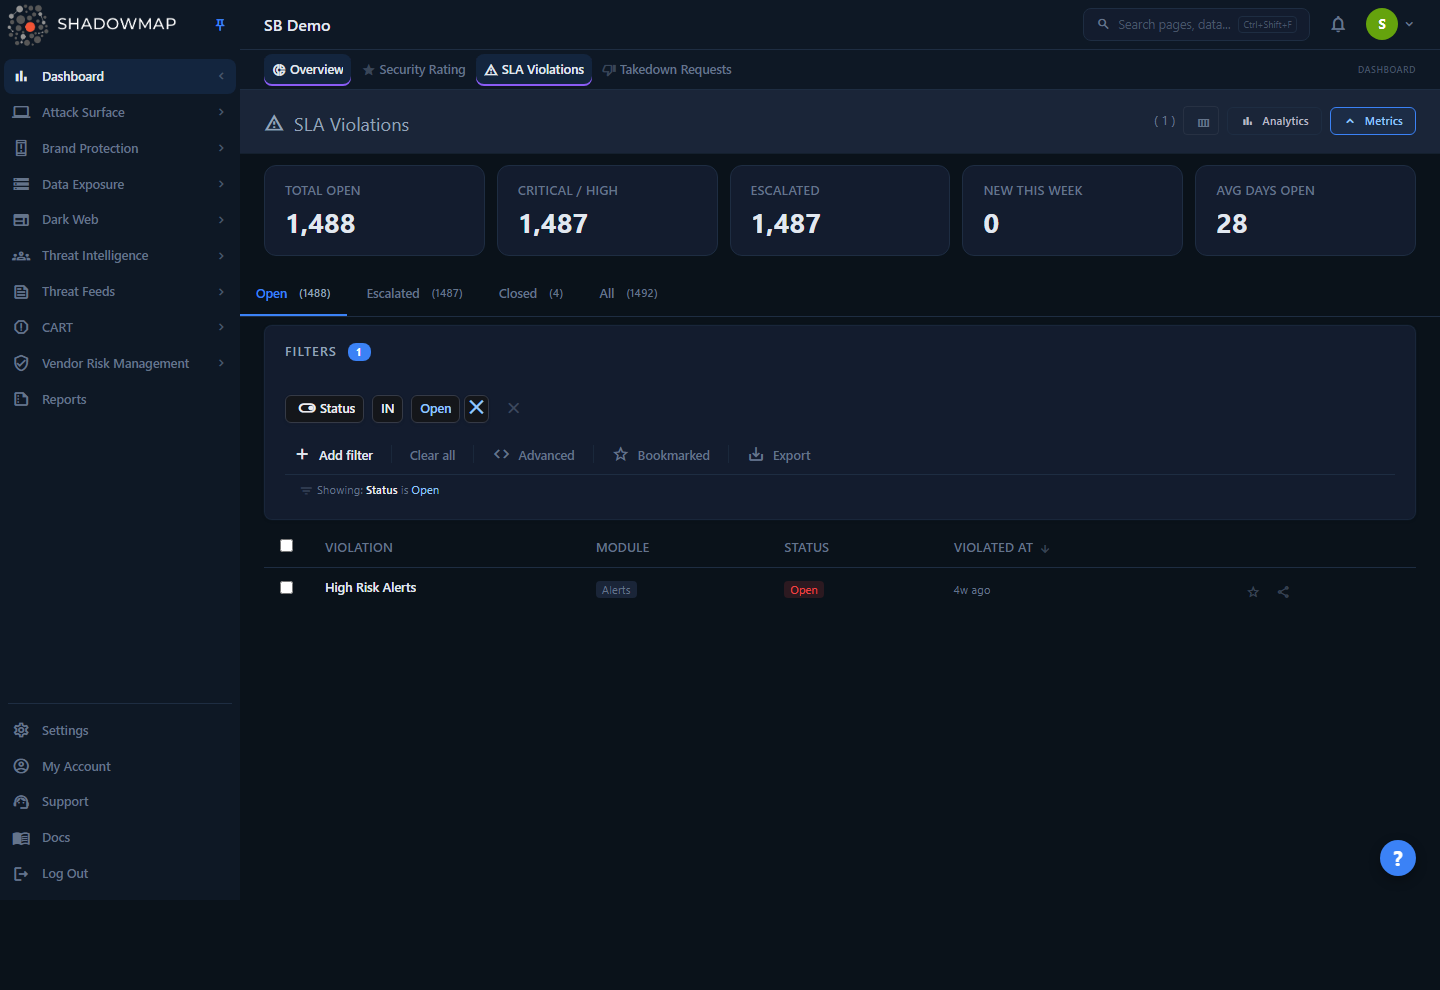
The page is a status-tabbed list of every SLA violation for your organization. Opening /dashboard/sla-violations redirects to the Open tab. Each row is one violation — a single finding (an alert, a leaked file, a phishing URL, an exposed S3 bucket, etc.) that matched an SLA policy and is now on the clock.
At the top you get a metrics strip (compliance KPIs), a collapsible analytics panel (trend and distribution charts), and four status tabs. Below that is the violations table with search, filters, bulk actions, bookmarking, and export. Clicking any row opens a detail drawer showing the policy, the underlying issue, the escalation history, and the notification delivery log.
Where violations come from
This page does not define SLAs. It only reports breaches. You author the rules — what to watch, the response deadlines, who to notify, and the escalation ladder — under Settings → SLA Policies (/settings/sla-policies). If this list is empty, you have no active SLA policies yet, or nothing has breached.
How it works
This is the part you cannot see from the UI. ShadowMap evaluates your SLA policies on every scan cycle and reconciles violations against the live state of each finding.
What an SLA policy is
An SLA policy ties together four things:
- A scope — a saved search that selects exactly which findings the policy applies to. A saved search can target one module (e.g. all open phishing URLs) or a precise slice of it (e.g. critical alerts on a specific brand). Because the scope is a saved search, an SLA policy can be pointed at any of a wide range of finding types — including Alerts, Exposures, Stealer Logs, Leaked APIs, Leaked Files, Domain Squatting, Phishing, S3 Buckets, Docker Containers, Data Breaches, Credit Card Leaks, Code Repositories, Telegram conversations, Ransomware Group & Forum discussions, and Malware-compromised Users/Computers.
- An immediate alert — the first notification, sent the moment a qualifying finding appears.
- Optional escalation levels — up to four (Escalation One through Four), each with its own time offset and its own set of notification actions.
- Notification actions — where each alert is delivered.
When a violation is raised
A background checker (the "violation checker") runs on each scan cycle. For every active policy, it pulls the findings matched by the policy's saved search and compares each one to any existing violation:
- New open finding, no existing violation → a violation is created with status Open and an immediate alert is dispatched. The violation's
created_atbecomes the start of its SLA clock. - Finding has been resolved/closed in its source module → the matching open violation is closed automatically. You do not have to close it by hand — fixing the underlying issue clears the violation on the next cycle.
- Finding still open, violation still open → if the policy has escalation enabled, the checker evaluates whether the next escalation level is due.
"Open" and "closed" are interpreted per module using that module's own status semantics. For example: an Alert is open when its status is new or open and closed when closed; a phishing URL is open while it is online and closed once offline; an S3 bucket is a violation while it is public and clears when remediated. You don't manage these mappings — ShadowMap derives the violation state from the finding's real state.
A violation tracks the issue, not a snapshot
Because closure is driven by the live finding, a violation is a faithful mirror of remediation. Remediate the asset and the violation closes itself; let it linger and the violation keeps escalating. There is no way for the two to silently drift apart.
How escalation timers work
Each escalation level has an offset and a unit (Days or Months). The level fires when:
violation.created_at (start of day) + offset ≤ todaySo a Level 1 escalation with an offset of 3 days fires once the violation has been open for 3 full days; a Level 2 with offset 7 fires at day 7, and so on. Months are converted to the equivalent number of days from the violation's creation date. Escalations always fire in order and at most one per cycle — the checker advances to the next undefined level only after the previous one has been recorded. Once every defined level has fired, the violation stops escalating but stays Open until the finding is resolved.
Each time a level fires, ShadowMap records an escalation-tracking entry (visible as Escalation Levels in the detail drawer) and queues that level's notification actions for delivery.
What "Escalated" means
There is no separate "escalated" status in the database — a violation is either Open or Closed. The Escalated tab and metric are a virtual state: an Open violation that has at least one escalation level on record. In other words, Escalated = Open + the deadline has already been missed at least once. These are your most urgent items.
Where notifications go
Immediate alerts and each escalation level deliver through whatever channels the policy's actions specify. Supported delivery channels:
| Channel | Notes |
|---|---|
| Direct to named recipients | |
| SMS | Text alert |
| Slack | Incoming webhook |
| Microsoft Teams | Incoming webhook |
| PagerDuty | Webhook / incident |
| Jira Service Management | Webhook |
| Jira Service Desk | Ticket creation |
| ServiceNow CMDB | Ticket / CMDB record |
| Freshservice | Ticket |
| SIEM (Syslog) | Forward to your SIEM |
| Splunk HEC | HTTP Event Collector |
| Webhook | Generic outbound webhook |
Every delivery is logged. The detail drawer's Delivery Log shows each attempt — the type (immediate vs. escalation level), the channel it went via, the timestamp, and the delivery status.
Understanding the data
Each row in the table represents one violation.
| Column | Meaning |
|---|---|
| Violation | The name of the SLA policy that the finding breached (e.g. "Critical Alerts — 48h"). This is always shown. |
| Module | The finding type the violation came from — Alerts, Exposures, Stealer Logs, Phishing, Leaked APIs, S3 Buckets, etc. Click the column header to sort. |
| Status | Open or Closed (see below). |
| Violated At | When the violation was first raised (the start of its SLA clock), shown as relative time. This is the default sort, newest first. |
Toggle which optional columns appear (Module, Status, Violated At) with the column customizer in the page header. The Violation column cannot be hidden.
Statuses
| Status | What it means |
|---|---|
| Open | The underlying finding is still unresolved and the violation is active. It will continue to escalate on its policy schedule. |
| Escalated | (Virtual — a filter, not a stored status.) An Open violation that has already fired at least one escalation level. Surfaced as its own tab and metric because these have already breached a deadline. |
| Closed | The underlying finding was resolved (auto-closed by the checker) or the violation was closed manually. No further escalations fire. |
Status tabs
| Tab | Shows |
|---|---|
| Open | Open violations that have not yet escalated (status Open, no escalation tracking). This is the landing tab. |
| Escalated | Open violations that have escalated at least once. |
| Closed | Resolved violations. |
| All | Every violation regardless of state. |
Each tab carries a live count badge.
Metrics strip
Five compliance KPIs sit above the tabs. Click any card to jump to the relevant tab.
| Metric | Definition |
|---|---|
| Total Open | Count of all Open violations. |
| Critical / High | Count of escalated violations. There is no severity column on a violation, so escalation is used as the urgency proxy — these have already missed a deadline. |
| Escalated | Open violations with at least one escalation recorded. |
| New This Week | Open violations raised in the last 7 days. |
| Avg Days Open | Mean age (in days) of all currently Open violations — a direct read on how stale your backlog is. |
Analytics panel
The collapsible analytics panel renders four charts (toggle it from the page header):
- 30-Day Violations Trend — new violations vs. resolved, day by day.
- By Module — share of violations per finding type (donut).
- Module Distribution — top modules by violation count (bar).
- Top Violated Policies — which SLA policies are breached most.
Clicking a slice or bar applies it as a quick filter on the list.
Filtering & search
Use the search/filter bar to narrow the list. Filterable fields:
| Filter | Notes |
|---|---|
| Policy Name | One or more SLA policy names. |
| Module | One or more finding types (Alerts, Exposures, Phishing, etc.). |
| Status | Open / Escalated / Closed. |
| Violated At | Date range on when the violation was raised. |
| Bookmarked | Restrict to violations you have starred. |
The free-text search box matches the SLA policy name. Filters and search are reflected in the URL, so any filtered view is shareable and bookmarkable.
- Bookmarked toggle (star) in the controls bar limits the list to violations you have starred.
- Sorting: click the Violation, Module, Status, or Violated At column headers. Default is Violated At, newest first.
- Pagination: 25 / 50 / 100 rows per page.
Keyboard navigation
With the list focused: j opens the next violation in the drawer, k opens the previous one, Esc closes the drawer, and ? toggles the shortcut help overlay.
Detail view
Click a row to open the detail drawer. It shows:
- Badges — Status, Module, and (when the policy defines one) Severity.
- Actions — Close Violation (only shown while Open) and Share.
- Violation Details — Violation ID, Policy, Module, the Issue (its title/host/name), Host, IP, and Created At.
- Escalation Levels — which escalation levels have fired (Level 1–4).
- Delivery Log — every notification attempt: type, channel, timestamp, and status.
Use the ‹ / › arrows (or k / j) to page through violations without leaving the drawer.
Taking action
| Action | Where | Effect |
|---|---|---|
| Close | Row → detail drawer, or select rows → bulk bar | Marks the violation Closed and stops further escalation/notifications. Note: closing a violation does not remediate the underlying finding — fix the asset to resolve the root cause. |
| Bookmark | Star on a row, in the drawer, or in bulk | Personal flag for follow-up; the Bookmarked filter shows only these. |
| Share | Row, drawer, or bulk | Share selected violations (e.g. to an integration/recipient). |
| Export | Export button in the controls bar | Generates an XLSX of the current filtered view, asynchronously. Your applied filters, sort, and search are carried into the export. |
Select multiple rows (the header checkbox selects all on the page) to reveal the bulk action bar for Close, Bookmark, and Share.
Closing vs. resolving
A violation auto-closes when its underlying finding is resolved in its home module. Manually closing a violation here only clears the SLA record — if the finding is still live, a new violation can be raised again on the next cycle. Treat manual close as "acknowledged / handled out-of-band," not "fixed."
Prerequisites
To see violations on this page you need:
- Read access to the SLA Violations dashboard (permission
dashboard.sla-violations). - At least one active SLA policy. Create policies under Settings → SLA Policies. A policy needs a saved search (the scope), an immediate-alert action, and — if you want time-based escalation — one or more escalation levels with offsets and notification actions.
What non-admin users see
Owner/admin users see every violation. Non-owner users only see violations whose policy is configured to notify them (via an email action addressed to them). If a teammate sees fewer rows than you, that is expected — the list is scoped to their notifications.
Common questions
Why did a violation close on its own? Because the underlying finding was resolved in its source module (the alert was closed, the phishing URL went offline, the bucket was secured, etc.). The checker auto-closes the violation on the next cycle. This is the intended behavior — remediation clears the SLA breach.
A violation is in the Escalated tab but I never set a severity. Why is it "Critical/High"? Violations don't carry a severity field. "Escalated" simply means an Open violation that has already missed at least one of its policy's deadlines, and the Critical/High metric uses that as the urgency proxy. It is telling you "this one is overdue," not assigning a CVSS-style rating.
A breach happened but I got no notification. Check the violation's Delivery Log in the detail drawer — it records each attempt and its status. If nothing was attempted, the policy may not have an action for that channel, the integration may be disconnected, or escalation may be disabled on the policy. Notifications are configured per policy under Settings → SLA Policies.
How fast is a violation raised after a finding appears? On the next scan/checker cycle after the finding becomes open — not instantaneously. The immediate alert is the first notification in the ladder; subsequent escalations fire on their day-based offsets from the violation's creation time.
Can one policy cover multiple finding types? Yes. The scope is a saved search, so a policy can target any slice of any supported module — and you can have many policies, each with its own deadlines and recipients.
I closed a violation but it came back. Manually closing only clears the SLA record; it does not fix the finding. If the underlying issue is still live, the checker can raise a fresh violation. Resolve the finding in its home module to make the closure stick.
What does "Avg Days Open" tell me? The average age of your currently-open violations. A rising number means breaches are sitting unresolved longer — a quick health check on your remediation throughput against the deadlines you committed to.
Related
- SLA Policies (Settings) — where you author the rules this page enforces: scope (saved search), immediate alert, escalation ladder, and notification channels.
- Alerts — the most common source of SLA violations; an SLA policy scoped to alerts is the canonical use case.
- Takedowns — the remediation workflow for brand/phishing findings whose SLA you may be tracking here.
- Security Rating — your overall posture score; SLA compliance complements it by measuring response discipline rather than exposure.
- Overview — the top-level dashboard that links into SLA Violations and the rest of your findings.