Overview
ShadowMap is an External Attack Surface Management (EASM) platform. It continuously discovers everything your organization exposes to the public internet — known and unknown — monitors it for risk, and gives your team a single place to triage and remediate what it finds.
You start from one or more seed identifiers (a primary domain, a brand name, executive names). ShadowMap expands outward from there, attributing assets back to you and grading their exposure, without you having to install agents or provide an inventory first. Everything described in these docs lives in the ShadowMap web dashboard.
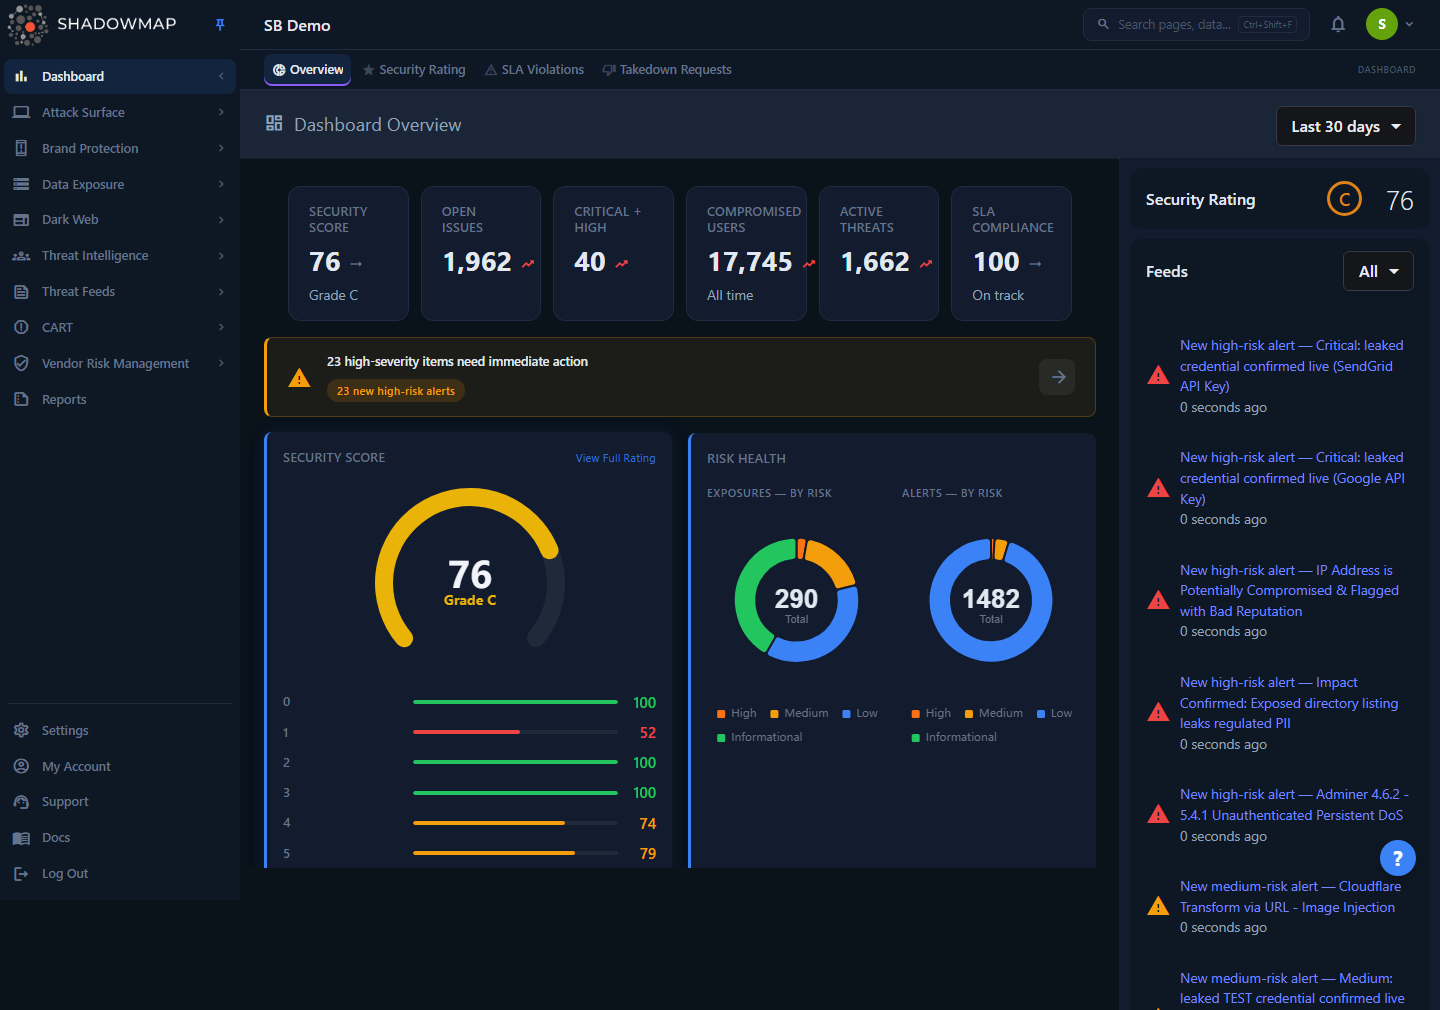
The Dashboard Overview — your landing page after login, summarizing security rating, open risks, and recent activity across every module.
The platform is organized into modules, each covering one slice of your external risk. The left sidebar groups them into:
| Group | What it covers | Start here |
|---|
| Dashboard | Security rating, executive views, an Action Center triage queue, cross-module asset exploration, SLA violations, takedown status | Dashboard Overview |
| Asset Inventory | The authoritative list of domains, subdomains, and IPs attributed to you | Asset Inventory |
| Attack Surface | Web apps, mobile apps, SSO endpoints, SSL certificates, JS trackers, links & redirects | Attack Surface Area |
| Brand Monitoring | Phishing, domain squatting, fake apps, social media, executive impersonation | Brand Monitoring |
| Threats | The consolidated alert queue, IP reputation, vulnerabilities, open ports, misconfigurations | Alerts |
| Dark Web | Breaches, stealer logs, compromised computers, credit-card leaks, forum & Telegram chatter | Dark Web Overview |
| Data Leaks | Leaked credentials, code, files, APIs, S3 buckets, open databases, Elasticsearch | Data Leaks Overview |
| Threat Intelligence | Threat actors, malware, ransomware, campaigns, IOCs, CVEs, MITRE ATT&CK | Threat Intel Overview |
| Vendor Risk | Third-party security ratings and assessment requests | Vendor Risk Management |
| Reports & Activity | Scheduled/on-demand reports and a full audit trail of platform activity | Reports · Activity |
How it works
These are the mechanics that apply across the whole platform — the things you cannot infer by clicking around a single page.
Discovery is continuous and seed-driven
You do not upload an asset inventory. ShadowMap is seeded with a small number of identifiers (primary domain, organization/brand names, key executives) and expands outward automatically — resolving subdomains, related IP ranges, certificates, mobile apps, and lookalike domains, then attributing each candidate asset back to your organization. Discovery runs on a recurring cadence, so new exposures (a freshly spun-up subdomain, a newly registered squatting domain, a fresh breach dump) appear without manual action. If you believe an asset is missing, see Missing Assets.
Everything is an asset or a finding
Two object types underpin the entire dashboard:
- An asset is something you own or that is attributed to you — a domain, subdomain, IP, web app, certificate, or mobile app. Assets live in Asset Inventory and the Attack Surface modules.
- A finding is an issue, exposure, or event tied to an asset — an open port, an expiring certificate, a phishing site, a leaked credential, a dark-web mention. Findings are what you triage.
Most modules are lists of findings. Each finding carries a severity and a status, and most can be commented on, tagged, bookmarked, exported, and escalated to a takedown. The shared mechanics behind those actions are documented once in Features rather than repeated per module.
Severity vs. status — two independent axes
Every finding has a severity (how bad it is) and a status (where it is in your workflow). They move independently:
- Severity — Critical, High, Medium, Low, Informational — reflects risk and drives sorting, dashboards, and SLA clocks. See Severity Levels.
- Status — typically Needs Review → Investigating → Closed (plus Accepted Risk) — reflects what your team has done about it. See Status Workflow.
A Critical finding you've marked Accepted Risk stops counting against you; an Open Low finding still sits in the queue. Understanding this split is the single most useful thing for working efficiently in ShadowMap — read Severity and Status Workflow.
Alerts consolidate findings across modules
The Alerts queue is the cross-module triage surface. Rather than visiting every module individually, alerts roll the noteworthy findings from across the platform into one prioritized, deduplicated list with severity, status, ownership, and SLA tracking. For most analysts, Alerts is the daily starting point and the individual modules are the drill-down.
The Security Rating quantifies exposure
The Security Rating is an objective 0–100 score derived from your open findings, weighted by severity and category. It lets you trend exposure over time, benchmark against peers, and report risk to leadership in a single number. The exact weighting is documented in How the Score is Calculated, and concrete remediation guidance lives in Improving Your Score.
Access is governed by roles and permissions
What you can see and do depends on your assigned role. Module visibility, exports, takedown submission, and settings access are all permission-gated, so two users in the same account may see different navigation. Administrators manage this under Members and Teams; the model is explained in Roles and Permissions and enumerated in RBAC and Permissions.
Finding your way around
Pick the entry point that matches what you're trying to do:
New to ShadowMap?
Read Key Concepts first, then open Alerts. The alert queue is the fastest way to understand what ShadowMap has found about your organization and start acting on it.
Common questions
What is EASM, and how is ShadowMap different from a vulnerability scanner? A vulnerability scanner needs you to tell it what to scan. External Attack Surface Management starts from the opposite end: it discovers your internet-facing assets — including shadow IT, forgotten subdomains, and third-party-hosted properties — then assesses them. ShadowMap also extends beyond infrastructure into brand abuse, dark-web exposure, and leaked data, which traditional scanners don't cover.
Do I need to install an agent or give ShadowMap access to my network? No. ShadowMap operates entirely from the outside, the same way an attacker would. There is nothing to deploy. You provide seed identifiers (a domain, your brand name, executive names) and the platform discovers the rest. Optional integrations like Cloud Sources can enrich discovery, but they are not required.
How often is the data refreshed? Discovery and monitoring run on a recurring schedule, so new assets and findings appear automatically over time. Different module types refresh at different cadences. Data lifecycle and how long records are retained are covered in Data Retention.
Why do two people in my company see different menus? Navigation is permission-gated by role. If a module or action is missing from your view, your role likely doesn't grant it — ask an administrator, and see Roles and Permissions.
Where do I start every day? Most teams start at the Alerts queue for triage and glance at the Dashboard Overview for posture. Individual modules are used to drill into a specific class of exposure.
An asset I own isn't showing up — what do I do? Attribution is automatic but conservative; some assets need confirmation or a seed update. See Missing Assets for how to add or attribute it.
How do I get help? The Troubleshooting section covers common issues, and Contacting Support explains how to reach the ShadowMap team.
- Getting Started — the recommended onboarding path, from first login to first triage.
- Key Concepts — the shared vocabulary (assets, findings, severity, status, SLA) used throughout these docs.
- Dashboard Overview — the post-login landing page that summarizes posture across all modules.
- Features — cross-cutting capabilities (search, tags, comments, exports, takedowns) that work the same way in every module.
- Reference — the FAQ, Glossary, Severity Levels, and Status Workflow for quick lookups.
- Settings — administrator configuration for members, teams, SLA policies, integrations, and scan profiles.