Navigating the Platform
ShadowMap puts everything behind a single persistent shell: an icon rail on the left for security domains, a horizontal sub-navigation strip for the pages inside the active domain, and a top bar for search and your account. Once you know how the three pieces fit together, every module works the same way.
Overview
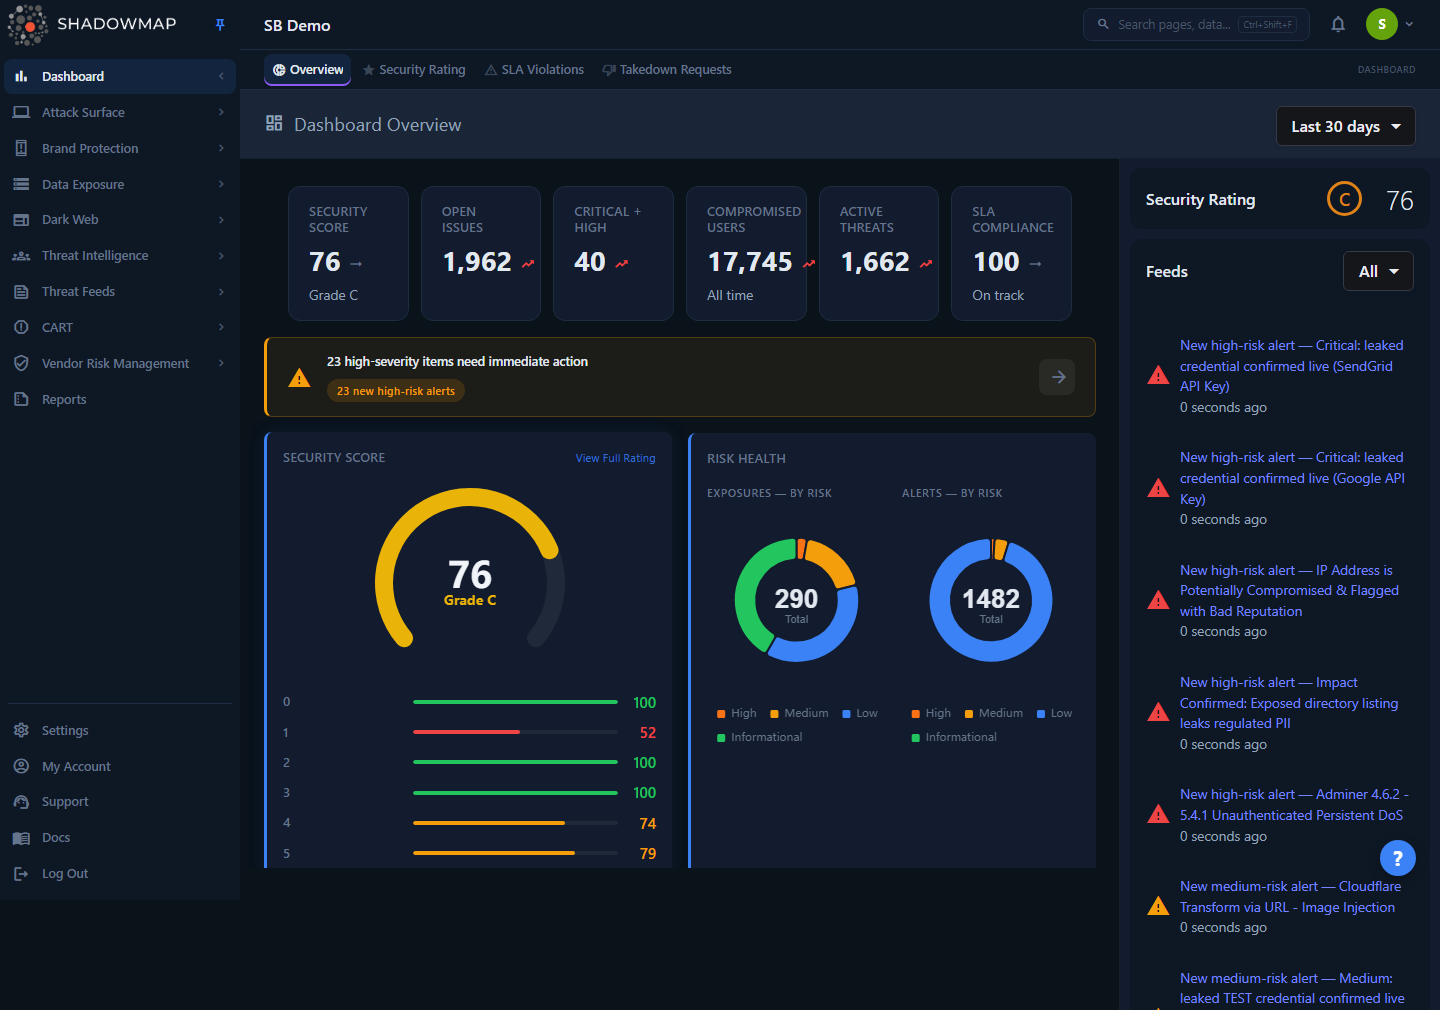
When you log in you land on the Dashboard Overview (/dashboard/overview) — the URL / and any unmatched landing redirect here. The screenshot above shows the standard layout you carry everywhere in the product:
- Icon rail (far left, ~56px): one icon per security domain — Dashboard, Attack Surface, Brand Protection, and so on — plus Settings, your account, and support pinned at the bottom.
- Top bar: your organization name and logo on the left; the search box, an alerts bell, and your user menu on the right.
- Sub-navigation strip: appears under the top bar when the active domain has multiple pages, rendering them as a horizontal row of tabs.
- Content area: the actual module — tables, dashboards, detail views — fills the rest of the screen.
The rail, top bar, and sub-nav are fixed; only the content area changes as you navigate. Nothing in the navigation is loaded that you don't have permission to see (see How it works).
How it works
These are the mechanics you can't read off the screen.
The icon rail expands on hover, locks with the pin
The rail is icon-only by default to maximize content width. Three states control its width:
| State | How you trigger it | Behavior |
|---|---|---|
| Collapsed | Default | 56px wide, icons only. Hovering an icon shows a text tooltip with the section name. |
| Hover-peek | Move the mouse over the rail | Expands to ~240px and shows labels, but overlays the content (does not push it). Slides back when you move away. |
| Pinned | Click the pin icon in the rail header | Locks the rail open at full width and pushes the content area right. Click the pin again to unpin. |
The pinned/unpinned choice is remembered in your browser (localStorage) per device. On your very first visit the rail opens pinned with a pulsing pin button so you can discover the navigation; after that it follows your saved preference.
TIP
In collapsed mode, a small badge on a domain icon shows how many pages live inside that domain. Hover to reveal them, or click to jump in.
Clicking a domain reveals its pages in the sub-nav
Domains are containers, not pages. Click a domain in the rail and two things happen:
- Its child pages render as tabs in the horizontal sub-navigation strip under the top bar.
- You're taken to the domain's first page (e.g. clicking Dark Web opens the Dark Web Overview).
When a domain has more tabs than fit on screen — Attack Surface has well over a dozen — the sub-nav scrolls horizontally, with fade gradients and chevron arrows at the edges signalling the hidden tabs. The active tab auto-scrolls into view so you can always see where you are.
A handful of rail entries have no children and act as direct links — Reports, for example — so clicking them navigates straight to the page with no sub-nav.
Navigation is permission-gated, so your menu may differ
The menu is built from your role's permissions, not from a fixed list. Every page is gated on a <module>:read permission, and ShadowMap removes anything you can't access before rendering the rail — a domain whose pages are all hidden disappears entirely. Consequences worth knowing:
- Two users in the same organization can see different domains and different tabs. This is expected, not a bug.
- Some entries are admin-only (for example Global Settings, Alert Preferences, Credential Checks, and Pipeline Notifications under Settings).
- A few deliverables are tenant-specific and only appear for the organizations they were built for.
If a teammate references a page you can't find, the difference is almost always a permission. See Roles & Permissions and the RBAC permissions reference.
Active-section highlighting follows the URL, not your clicks
ShadowMap reads the browser URL and highlights the deepest-matching rail icon and sub-nav tab. This means deep links, bookmarks, and the browser back/forward buttons all keep the navigation in sync — open a saved URL straight to /threats/alerts and the CART domain lights up with Alerts active, even though you never clicked the rail. Status suffixes in a URL (such as a /needs_review tab) don't break the match; the closest page still highlights.
The icon rail, domain by domain
These are the top-level domains in the rail, top to bottom. The exact set you see depends on your permissions. Names below match the in-app labels.
| Domain | What it covers | Related docs |
|---|---|---|
| Dashboard | Overview, Security Rating, SLA Violations, Takedown Requests | Overview, Security Rating |
| Attack Surface | Web & mobile applications, SSO, JS trackers, SSL certificates, open ports, network services, technology stack, asset inventory (domains, subdomains, IPs, internal hosts), links & redirects, CMDB reconciliation | Web Applications, Open Ports |
| Brand Protection | Brand overview, fake applications, phishing & impersonations, domain squatting, executive monitoring, social media | Phishing & Impersonations, Domain Squatting |
| Data Exposure | Overview, code repositories, leaked credentials, S3 buckets, Docker containers, leaked files, leaked APIs, shortener URLs, Elasticsearch instances | Code Repositories, Leaked Credentials |
| Dark Web | Overview, data breaches, discussions, compromised users & computers, compromised cookies/tokens/cards/wallets/autofills, browser history, Telegram conversations | Data Breaches, Stealer Logs |
| Threat Intelligence | Overview, threat actors, malware, ransomware, campaigns, indicators (IOCs), vulnerabilities (CVEs), MITRE ATT&CK | Threat Intelligence overview, Vulnerabilities |
| Threat Feeds | Threat feed, cyber news, media monitoring, regulatory intelligence | Threat Feed, Cyber News |
| CART | Alerts, IP Reputation, Vulnerability Overview | Alerts, Vulnerability Overview |
| Vendor Risk Management | Overview, vendors, requests (third-party risk) | Vendor Risk Management |
| Reports | Standalone link to generated reports | Reports |
CART
"CART" groups the operational, action-oriented surfaces. Alerts is the workhorse: the consolidated, SLA-tracked queue of findings that need a human decision. Most analysts live here day to day.
At the bottom of the rail, separated by a divider, are the workspace controls:
| Entry | What it covers |
|---|---|
| Settings | Teams, members, comment templates, priority subdomains, integrations, cloud sources, credential checks, SLA policies, tags & rules, vulnerability scan profiles, executive dashboards, activity logs, audit logs, alert preferences, global settings |
| My Account | Profile, Security & 2FA, Notifications, Sessions, Saved Searches |
| Support | Opens the in-app support menu |
| Docs | Opens this documentation site in a new tab |
| Log Out | Ends your session |
Settings entries are organized into groups — Organization, Integrations, Policies, Administration — when you open the Settings area. See the Settings index and My Account profile.
Search: pages and data in one box
The search box in the top bar (or the keyboard shortcut Ctrl+Shift+F) opens a command palette that searches two things at once:
- Pages & Features — an instant, client-side filter over every page you have access to. Type "ports", "sla", "phishing" and jump straight there. Results respect your permissions.
- Data Results — a debounced, server-side search across your actual findings. ShadowMap detects what you typed — an ID, IP address, hostname, domain, or URL — and returns matching items grouped by module, with a per-status breakdown (e.g. Alerts: 12 items — needs_review: 8, closed: 4).
Click a data-result module to open that module deep-linked and pre-filtered to your search term (in a new tab). For example, searching a hostname and clicking the Phishing result opens Phishing & Impersonations already filtered to URLs containing that host. Searching a bare ID can route you directly to that item's detail view.
The palette remembers your recent searches and supports arrow-key navigation with Enter to open the highlighted result; Esc closes it.
TIP
Universal search is the fastest way to pivot when you have an indicator in hand — paste an IP, domain, or finding ID and let ShadowMap tell you which modules it appears in. See Universal Search.
Patterns shared across every module
Once inside a module, the interface is consistent. Learning it once means you can work any page.
List and table views
Most modules present findings as a filterable table:
- Status tabs — many modules split their queue into workflow states (for example Needs Review, Online/Offline, All). The tab is part of the URL, so it's bookmarkable and shareable.
- Column sorting — click a column header to sort.
- Filtering & search — a filter bar narrows the list by fields like status, severity, date range, and tags; a search box does full-text search within the current view.
- Bulk actions — select multiple rows to change status, tag, or take action on them together.
- Export — download the current view (see Exports).
- Pagination — page through large result sets at the bottom.
For the meaning of the status and severity values you'll see throughout, read the Status workflow and Severity levels references.
Detail views
Click any row to open its detail view. Depending on the module, this typically shows the full finding, an activity timeline, comments and internal notes, status and tag controls, and links to related findings.
Cross-cutting features
The same toolset is available almost everywhere:
| Action | What it does | Docs |
|---|---|---|
| Tags | Apply custom labels to findings for organization and filtering | Custom Tags, Tag Rules |
| Comments | Record investigation notes and decisions on a finding | Comments |
| Bookmarks | Save individual findings to revisit | Bookmarks |
| Saved Searches | Save a filter set to reuse or share | Saved Searches |
| Status changes | Move a finding through its remediation workflow, with SLA tracking | Severity & Status, SLA Policies |
| Keyboard shortcuts | Navigate and act without the mouse | Keyboard Shortcuts |
Common questions
Why does my colleague have menu items I don't see? Navigation is built from each user's permissions. Domains and pages you can't read are removed before the rail renders, so two people in the same organization can have different menus. Ask an administrator if you need access to a missing page. See Roles & Permissions.
The sidebar keeps collapsing when I move my mouse away. How do I keep it open? That's hover-peek, an overlay that retracts by design. Click the pin icon in the rail header to lock it open — that state pushes the content and is remembered on your device.
Where do I start after logging in? The Dashboard Overview is your landing page and the best starting point — it summarizes your security rating, open alerts, and items needing attention. From there, CART → Alerts is where most triage work happens. See the Dashboard Overview and Alerts.
Can I link straight to a specific page or filtered view? Yes. URLs encode the page, the status tab, and (via the q query parameter) the active filter. Bookmark or share a URL and it reopens to the same view with the correct navigation highlighted. Saved Searches do the same for filter sets.
Is there a faster way to jump between modules? Open search with Ctrl+Shift+F, type the page or feature name, and press Enter. The same box also finds your data by ID, IP, hostname, domain, or URL. See Universal Search and Keyboard Shortcuts.
What is the "Docs" link in the rail? It opens this documentation site (docs.shadowmap.com) in a new tab. The "Support" entry next to it opens the in-app support menu for contacting the team.
Related
- First Login — what to do the first time you sign in.
- Key Concepts — the vocabulary (findings, assets, modules) the navigation is organized around.
- Roles & Permissions — why your menu looks the way it does, and how access is granted.
- Universal Search — the command palette in depth.
- Keyboard Shortcuts — move and act without the mouse.
- Dashboard Overview — your landing page and the natural starting point.
- Status workflow and Severity levels — the states and priorities used across every module.