Web Applications
Web Applications is the inventory of every internet-facing HTTP/HTTPS service ShadowMap attributes to your organization — one row per live endpoint, enriched with hosting, technology, and vulnerability context, and wrapped in a triage workflow so your team can work the queue instead of staring at a list. It is the largest and most actively used view in the Attack Surface module.
Overview
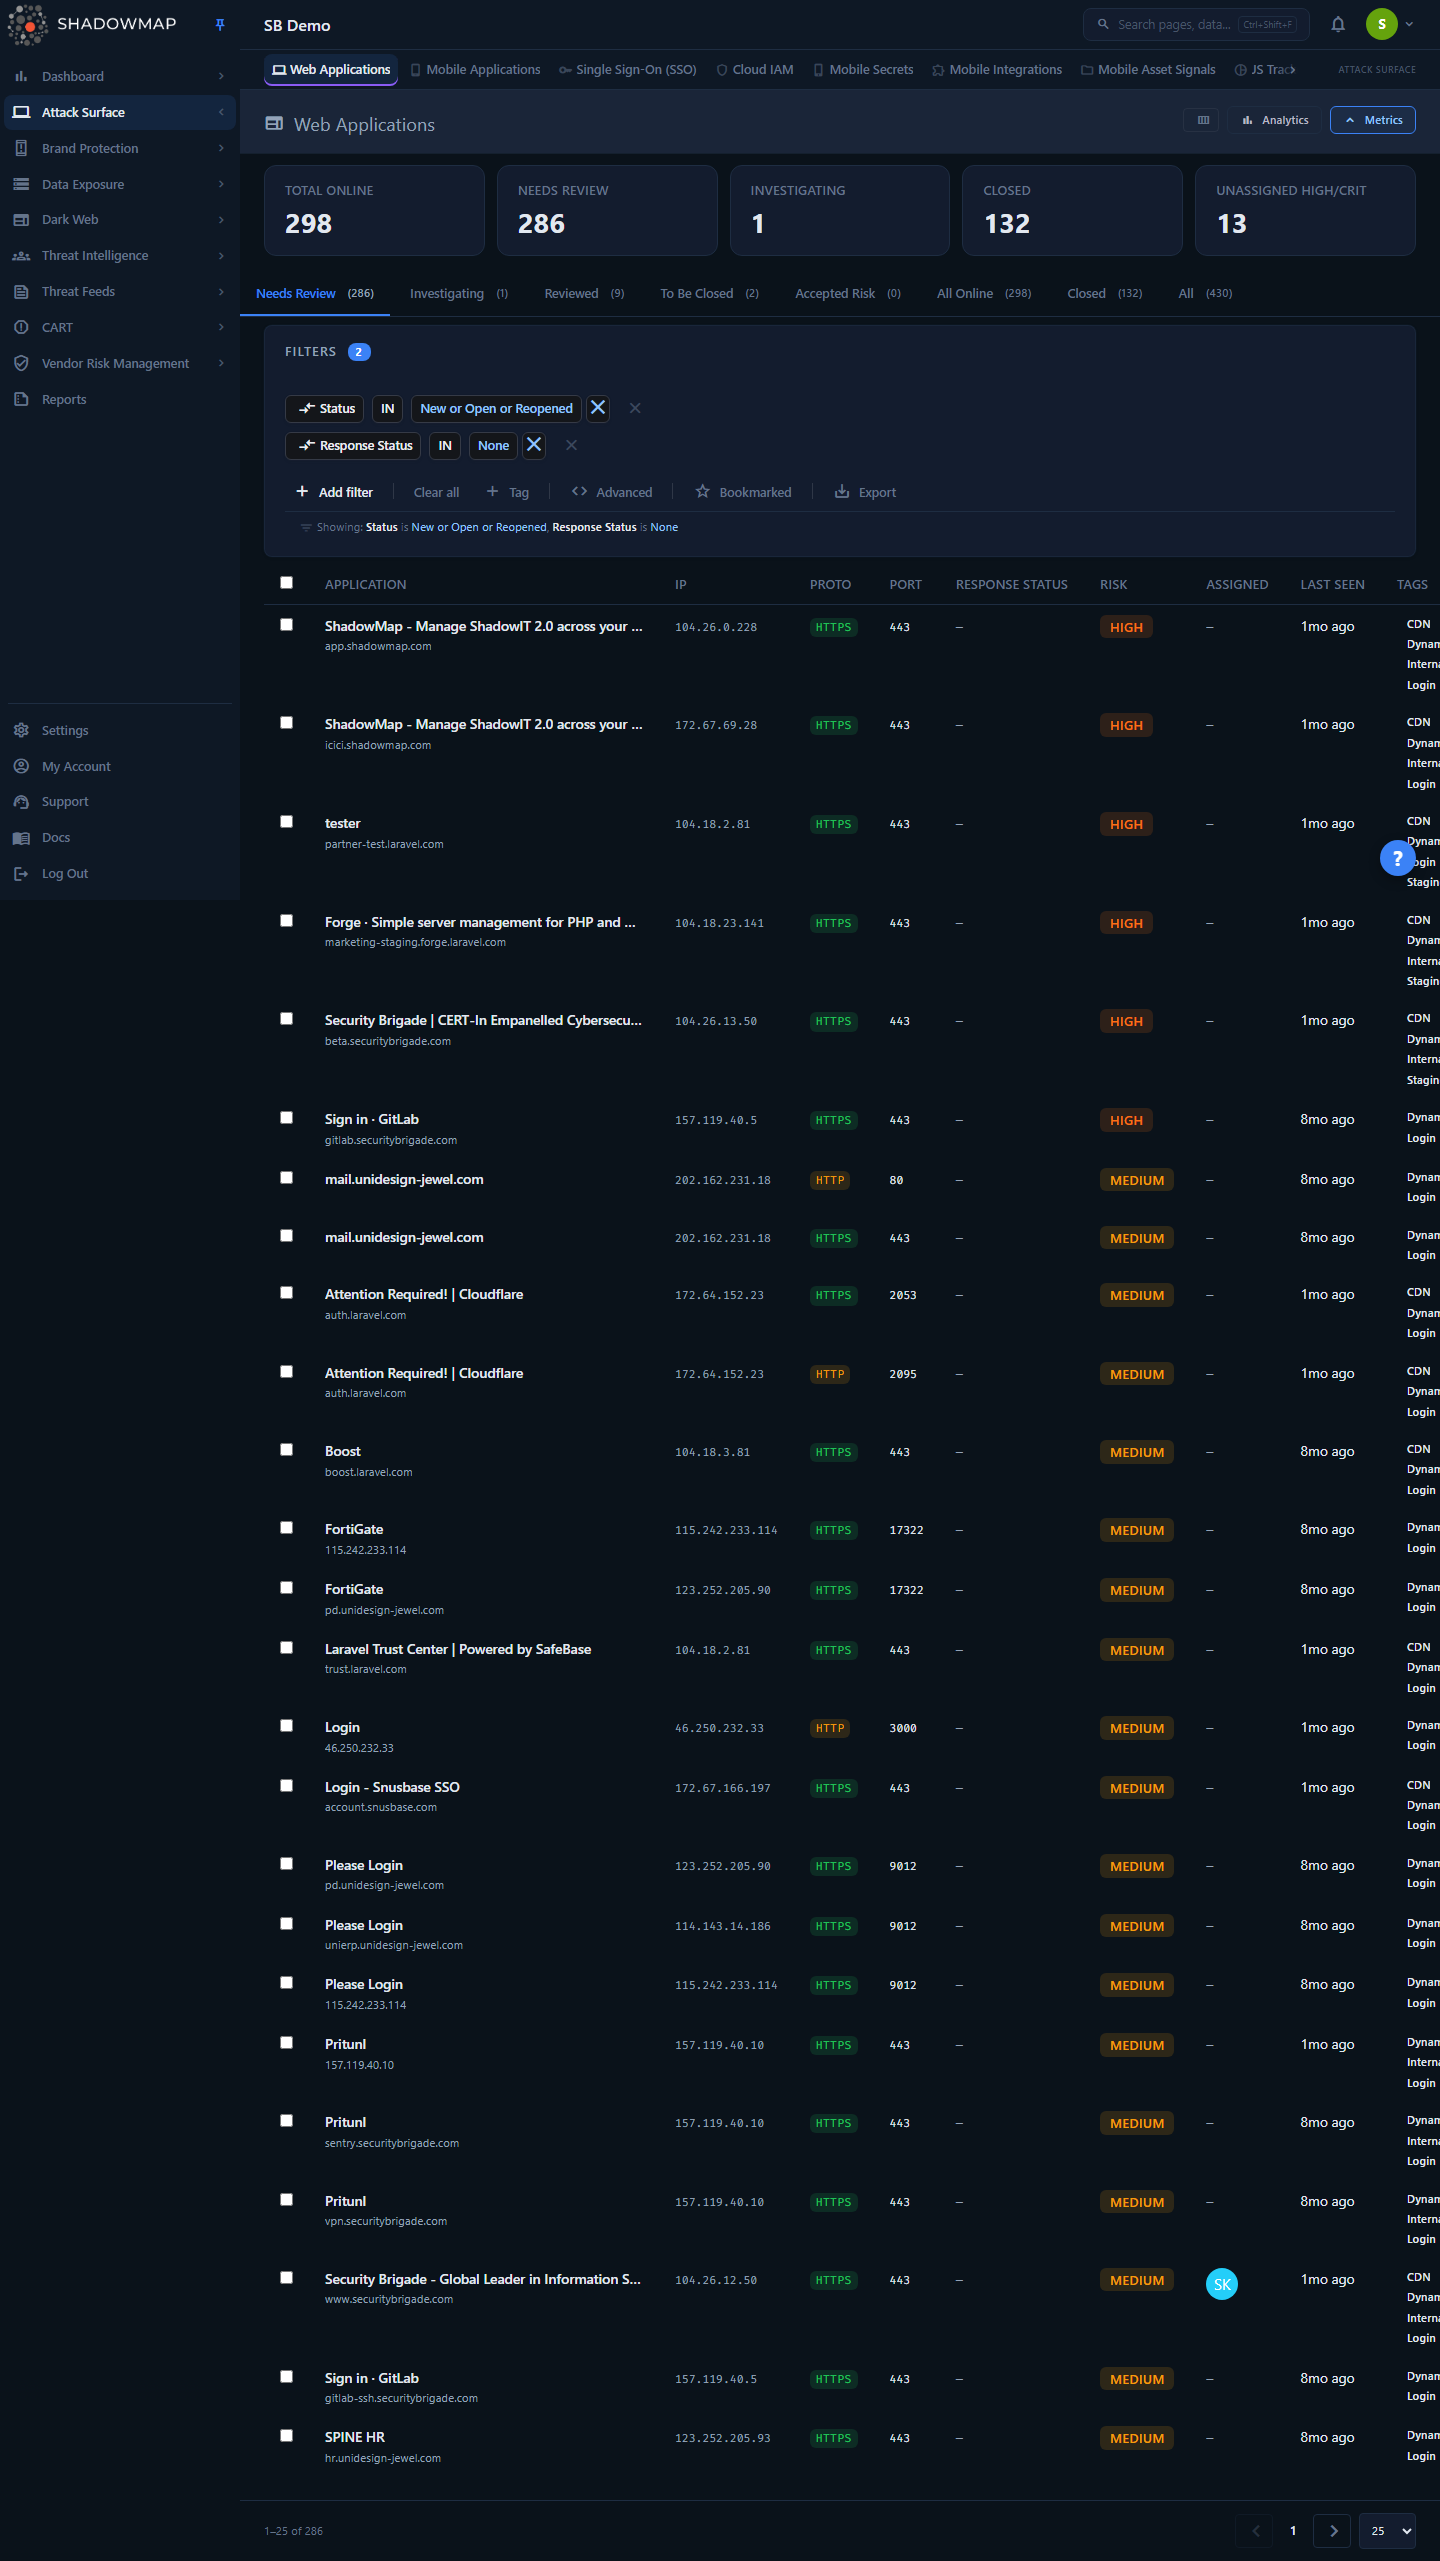
The page is built around four stacked layers, top to bottom:
- Metrics strip — five headline counts (Total Online, Needs Review, Investigating, Closed, Unassigned High/Crit). The first four are clickable and jump you to the matching status tab.
- Analytics panel — four charts (Risk Distribution, 30-Day Discovery Trend, Top Hosts, Geographic Distribution). Clicking a slice in Risk Distribution or a bar in Top Hosts applies it as a filter. Collapse the panel from the page header when you want more room for the table.
- Status tabs — the triage workflow: Needs Review, Investigating, Reviewed, To Be Closed, Accepted Risk, All Online, Closed, All. Each tab carries a live count.
- Table — one row per discovered endpoint, with the filter bar, bulk-action bar, column customizer, detail drawer, and pagination.
Each row is a single externally reachable service. Click a row to open the detail drawer; use Open full page in the drawer to jump to the full detail page for the deep technical view (Overview, Infrastructure, History, Compliance, Activity).
How it works
These are the mechanics you cannot infer from looking at the table.
What counts as one application
ShadowMap stores one application row per unique endpoint, where uniqueness is the tuple:
md5( protocol + lower(host) + port + lower(path) )This is why http://app.example.com:80/ and https://app.example.com:443/ are two separate rows even though they share a host — different protocol and port mean a different exposure. It is also why the Proto and Port columns are on by default: without them, endpoints that differ only by protocol or port collapse into visually identical rows. The data is honest; turning those columns off just hides the discriminator.
"Online" vs "Closed" is a status, not a live ping
The tabs and the Total Online metric are driven by the finding's status, not a real-time reachability check at the moment you load the page:
- Online = status is New, Open, or Reopened (the scanner has seen it live and it has not been closed).
- Closed = status is Closed (taken offline, decommissioned, or dismissed by an analyst).
When the scanner stops seeing an endpoint, it transitions toward Closed; when it reappears, it reopens. The Last Seen column tells you when the scanner last actually observed the service reachable.
CDN and WAF shadowing
A single origin behind a CDN or WAF can surface as many near-identical rows (the same app answering on many edge IPs). ShadowMap de-duplicates these: a CDN-fronted row is suppressed from the live list when a matching live origin with the same protocol/host/port/path identity already exists, so you triage the origin once instead of chasing every edge node. Rows that are served from behind a WAF are flagged inline with a Behind WAF badge — useful context when an endpoint looks exposed but is actually shielded.
Where risk comes from
The Risk column (Critical / High / Medium / Low / Informational) is ShadowMap's calculated rating, derived from the endpoint's detected technology stack, known CVEs correlated to those technologies, exposure characteristics, and threat-intelligence signals — not a value you set. You can override it per finding with Suggested Risk on the detail page when your team's assessment differs from the automated one; the calculated value is preserved underneath.
Discovery and attribution
Applications are found through ShadowMap's continuous scanning pipeline — domain and subdomain enumeration, IP and netblock sweeps, certificate transparency, and resolution. Each application records why it is attributed to you (domain owned, IP owned, SSL certificate linked), visible as Confidence Attribution signals on the Infrastructure tab. The pipeline runs continuously, so the list and the 30-Day Discovery Trend reflect newly surfaced services over time rather than a one-shot snapshot.
Understanding the data
Columns
The table is column-customizable (open the column customizer from the page header). The Application column is always shown; the rest can be toggled. Defaults are marked below.
| Column | Default | What it shows |
|---|---|---|
| Application | On (locked) | The endpoint title, or the host if no page title was captured. A Behind WAF badge appears when the service is shielded; the host is shown as a subtitle. |
| IP | On | Resolved IP address serving the endpoint. |
| Proto | On | http or https. Part of the uniqueness key. |
| Port | On | TCP port the service answers on. Part of the uniqueness key. |
| Path | Off | URL path of the endpoint. Part of the uniqueness key. |
| Response Status | On | The analyst-set triage response (None, Investigating, Reviewed, To Be Closed, Accepted Risk, Closed). See the note below. |
| Risk | On | Calculated risk rating. Sortable. |
| Assigned | On | The team or user the finding is assigned to. |
| Provider / ASN | Off | Hosting provider / autonomous system. |
| Country | Off | Geolocation of the hosting IP. |
| Last Seen | On | When the scanner last observed the endpoint live, as relative time. Sortable. |
| Tags | On | Security tags and custom tags applied to the finding. |
"Response Status" is your triage response, not an HTTP status
The Response Status column is named to look like an HTTP code, but it is the analyst-assigned triage response — the disposition your team set (Reviewed, Accepted Risk, etc.). A row with no triage response yet shows —. The underlying status (New / Open / Reopened / Closed) is separate and is what the workflow tabs filter on.
The status workflow
Every application carries two related fields:
- Status — the lifecycle state the scanner and your team move it through: New, Open, Reopened, Closed.
- Response — the triage disposition an analyst assigns while the finding is still open.
The tabs combine these so you always work a meaningful slice:
| Tab | What it contains |
|---|---|
| Needs Review | Open findings with no triage response yet — your inbox. New discoveries land here. |
| Investigating | Open findings an analyst has started reviewing but not concluded. |
| Reviewed | Open findings confirmed as known, authorized assets. |
| To Be Closed | Open findings flagged for decommissioning but not yet offline. |
| Accepted Risk | Open findings whose known risk has been formally accepted (remediation cost outweighs risk). |
| All Online | Every open finding (New / Open / Reopened), regardless of triage response. |
| Closed | Findings that have been closed. |
| All | Everything, with no status preset. |
Selecting a tab pre-loads the matching filter rules into the filter bar, so you can see exactly what the tab is querying and refine from there.
Filtering and search
The filter bar supports ShadowMap's structured query builder with AND/OR conditions. Available filter categories:
| Category | Notes |
|---|---|
| Title, Host, Domain, Path | Match on the endpoint identity. |
| IP, Netblock, ASN | Network-level filters. |
| Protocol, Port | The uniqueness discriminators. |
| Status, Response Status, Priority (Risk) | The workflow and severity fields. |
| Assigned To | Filter by team or user. |
| Country, Continent | Geolocation. |
| Organization | Attribution. |
| Technology Stacks, JS Trackers, SSO Provider | Fingerprint-based filters — e.g. "every app running a given product." |
| Tag, Tag Rule, Custom Tags | Standard tags, auto-tag rules, and custom key:value tags. |
| SLA Policy Violation | Findings breaching an SLA policy. |
| First Seen On, Last Seen On | Date-range filters. |
| Bookmarked | Restrict to bookmarked findings. |
Two quick toggles sit beside the filter bar:
- Bookmarked — show only items you have starred.
- Export — export the current filtered view (see Taking action).
Save recurring queries
Any filter combination can be saved for reuse. See Saved Searches and Tag Rules for auto-classifying future discoveries that match a filter.
Detail view
Clicking a row opens the detail drawer for a fast look without leaving the list. Use j / k to step through rows, Esc to close, s to bookmark, and Space to select. The drawer shows the risk / response / status badges, quick status actions (Investigating, Reviewed, Accept Risk, Close), the core fields (host, IP, port, protocol, domain, provider, country, assignee, first/last seen), tags, technology, and a captured screenshot of the page. The full live URL is linkable, and Open full page jumps to the complete record.
The full application detail page (.../application/{id}/details) has five tabs:
| Tab | What it contains |
|---|---|
| Overview | Screenshot, applied tags, Threat Exposure (counts of technologies, CVEs, critical CVEs, and KEV-listed CVEs, plus the detected tech stack and a CVE table linking to each vulnerability), Similar Applications, and an "About IP" sidebar with ASN/provider, netblock, country, and open ports on that IP. |
| Infrastructure | Confidence Attribution signals (Domain Owned, IP Owned, SSL Cert Linked), Mapped Hosts (all hosts resolving to/serving this app — useful for spotting shared hosting or CDN setups), and raw WHOIS for both the host and the IP. |
| History | Status History (every status change with timestamp) and Scan Detection History (every scan in which the endpoint was detected). |
| Compliance | SLA Policy Violations for this finding, split into Open and Closed, with the violated policy name and details. |
| Activity | Audit timeline of all actions on the finding — status changes, comments, assignments, tag changes, and any emails sent. |
Taking action
Actions apply to a single finding (row actions or the detail drawer) or to many at once (select rows to reveal the bulk-action bar).
| Action | Single | Bulk | Effect |
|---|---|---|---|
| Change status | Yes | Yes | Move through the workflow: Investigating, Reviewed, Accept Risk, To Be Closed, Close. |
| Suggested Risk | Yes (detail page) | — | Override the calculated risk rating for the finding. |
| Assign / Clear assignee | Yes | Yes | Route the finding to a team or user, or unassign it. The assignee picker filters teams and people as you type. |
| Bookmark | Yes (row / s) | Yes | Star findings for quick recall via the Bookmarked filter. |
| Add tag | — | Yes | Apply a custom key:value tag to the selected findings. |
| Comment | Yes (row) | — | Add investigation notes; comment templates from Settings are available. |
| Share | Yes | Yes | Share finding details with a colleague or stakeholder. |
| Export | — | — (view-level) | Export the current filtered view, honoring AND/OR conditions, as a background task that produces a downloadable file. |
Write access required
Status changes, assignment, tagging, and risk overrides require write permission on the Web Applications module. Without it, the view is read-only. See Roles & Permissions.
Common questions
Why do I see two rows for what looks like the same site? Because each row is a unique protocol + host + port + path endpoint. An HTTP and an HTTPS listener on the same host, or the same host answering on two ports or two paths, are genuinely distinct exposures and are tracked separately. Turn on the Proto, Port, and Path columns to see what differs.
The list says an app is "Online" but it's actually down — why? Online/Closed reflect the finding's workflow status, which transitions over multiple scans, not an instant ping when you open the page. Check the Last Seen column for when the scanner last actually observed it live; if it has gone away, it will move toward Closed on subsequent scans.
What's the difference between "Status" and "Response Status"? Status is the lifecycle state (New / Open / Reopened / Closed) the tabs filter on. Response Status is the triage disposition an analyst assigns (Reviewed, Investigating, Accepted Risk, etc.) while a finding is still open. The column header reads "Response Status" but it is not an HTTP code.
How is the Risk rating decided, and can I change it? It is calculated from the detected technology stack, correlated CVEs, exposure characteristics, and threat intel. You can override it per finding with Suggested Risk on the detail page; the calculated value is retained underneath.
Why did a flood of near-identical CDN endpoints disappear from my list? ShadowMap suppresses CDN-fronted duplicates when a matching live origin (same protocol/host/port/path) already exists, so you triage the real origin once instead of every edge IP. A Behind WAF badge marks endpoints served from behind a WAF.
Can I find every app running a specific technology? Yes — filter by Technology Stacks (also JS Trackers or SSO Provider). This is the fastest way to scope the blast radius of a newly disclosed CVE across your attack surface, then pivot affected hosts into a saved search or bulk assignment.
Related
- Mobile Applications — the app-store counterpart to this web inventory.
- SSL Certificates — certificates protecting these web applications.
- Technology Stack — the technology fingerprints that feed the risk rating and CVE correlation here.
- Single Sign-Ons and JS Trackers — third-party integrations and scripts detected on these applications.
- Open Ports and Network Services — the network-layer exposures on the same hosts.
- Vulnerability Overview — CVEs across your assets, correlated to the technologies surfaced here.
- Domains and Subdomains — the parent assets these web applications resolve to.
- SLA Policies and Tag Rules — drive the Compliance tab and automate tagging of new discoveries.