Technology Stack
Technology Stack rolls up the per-application technology fingerprints from your web-app scans into a single, deduplicated inventory. Instead of asking "what does this one site run?", it answers "everywhere across my attack surface, where do I run nginx 1.18 / jQuery 1.x / WordPress?" — which is exactly the question you need answered when a new CVE drops for a widely deployed component.
Overview
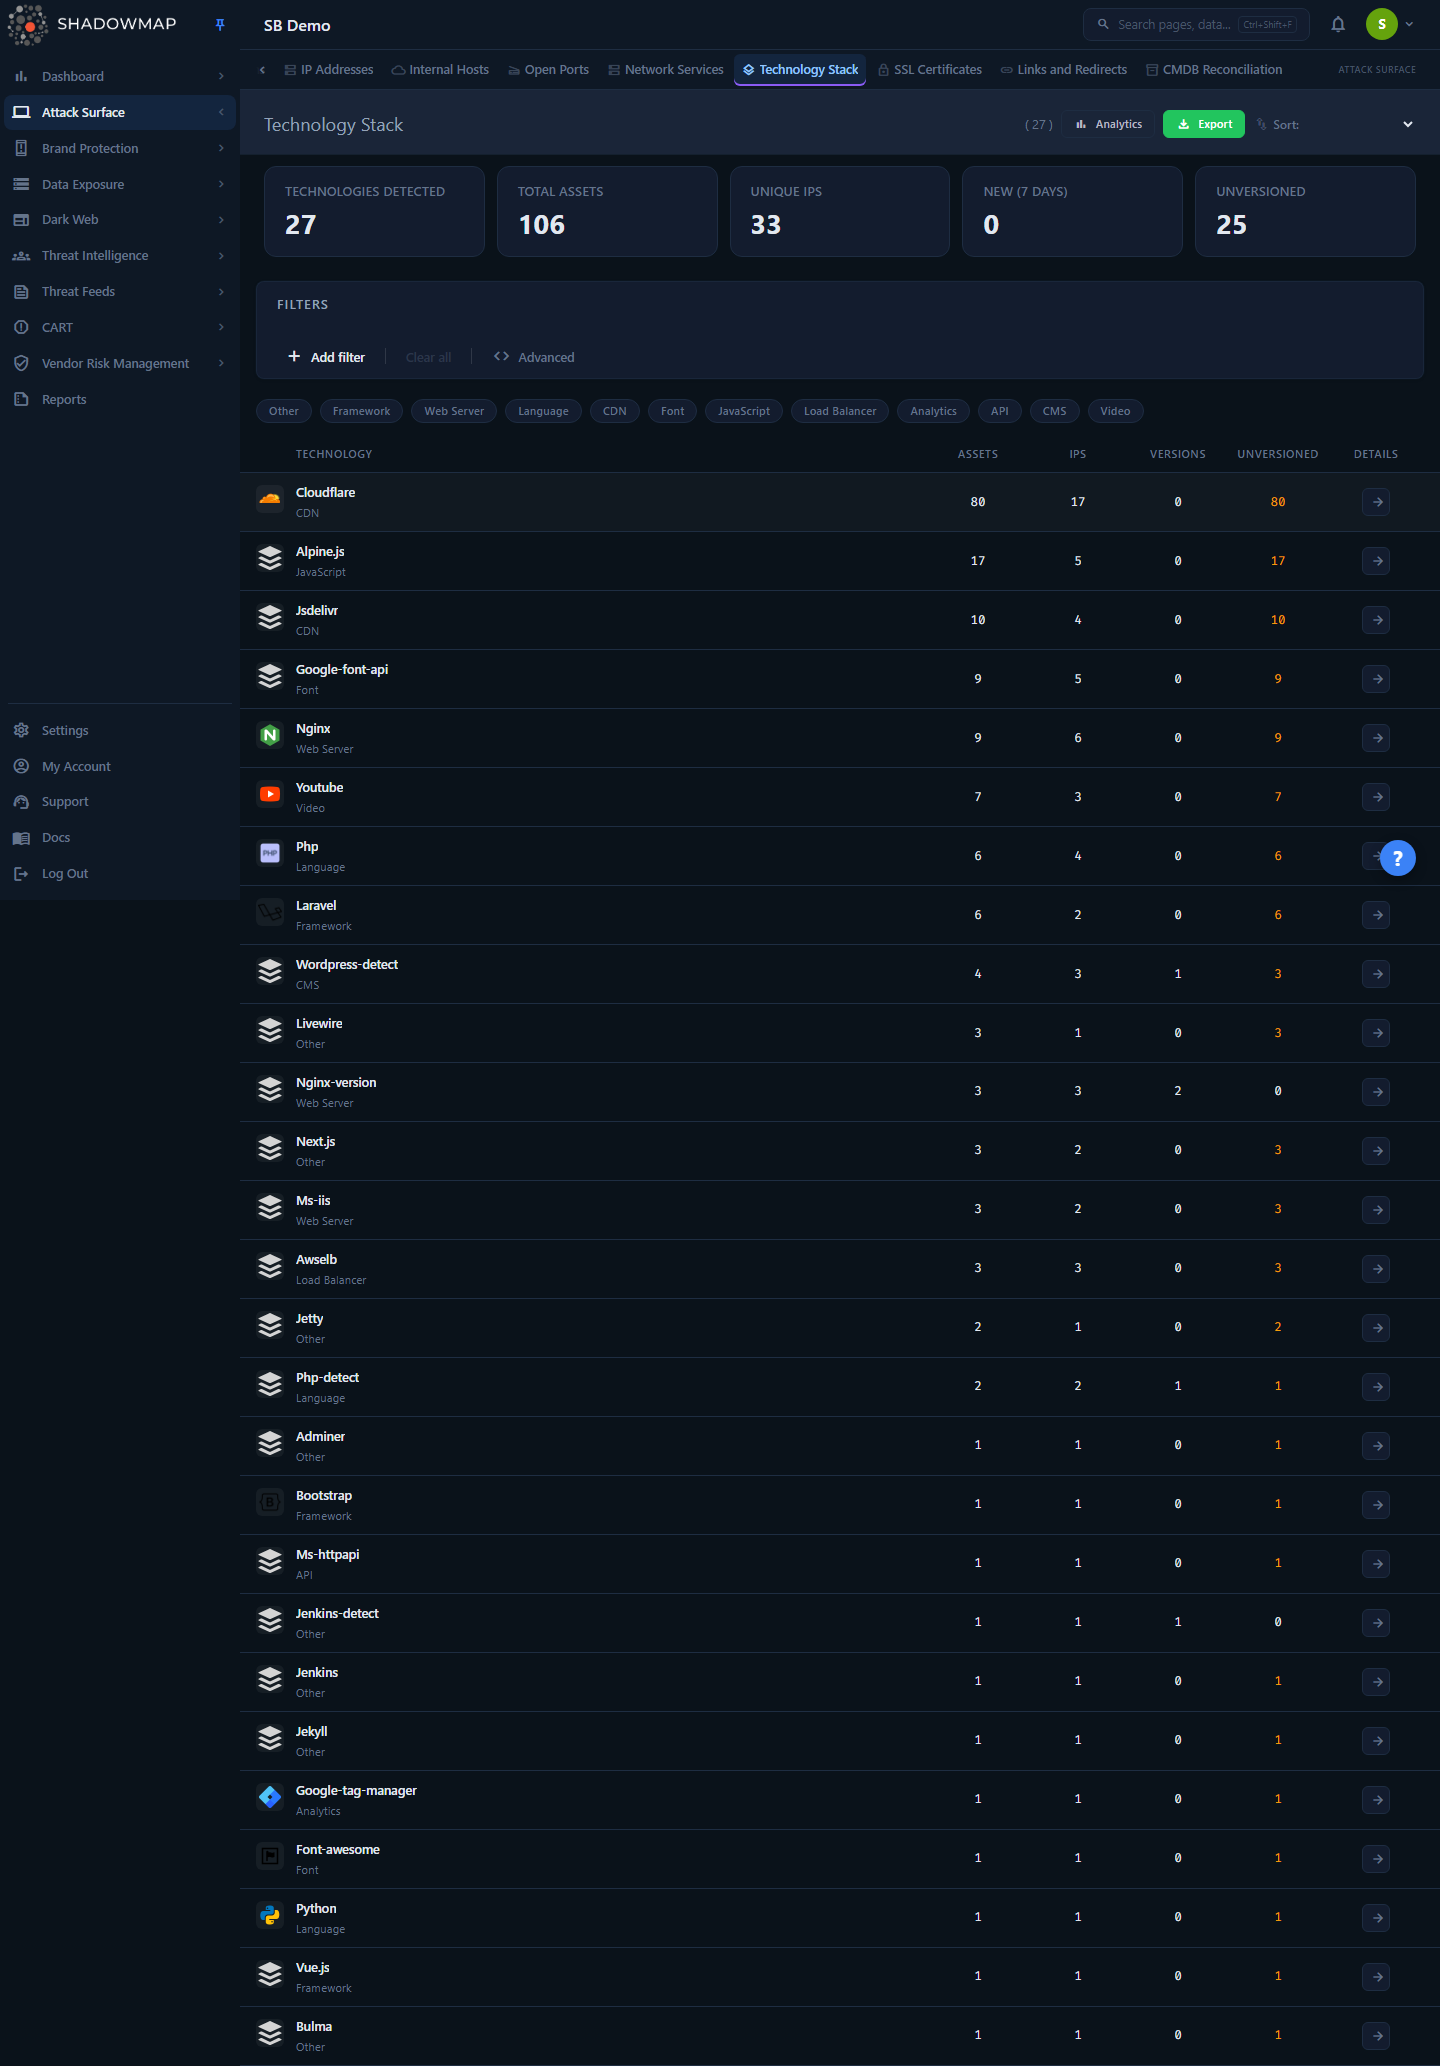
The page is a single grouped table. Each row is one technology (e.g. nginx, jQuery, Cloudflare), not one asset — so a technology installed on 400 hosts appears once, with 400 in the Assets column. Above the table sits a five-card metrics strip summarizing the landscape, an optional analytics panel with category and top-technology charts, a structured search/filter bar, and category quick-filter chips.
Clicking any row opens the technology's detail view, where you can see the version-by-version breakdown, the exact assets running it, and other technologies that co-occur on the same assets.
How it works
These are the mechanics you cannot infer from the UI:
Where the data comes from. Every row is derived from the application_technology records produced by ShadowMap's web-application fingerprinting during a scan. As the scanner crawls each discovered web application, it identifies the server software, frameworks, CMS, JavaScript libraries, analytics tags, CDNs, and other components in use — along with a version string where one can be determined. Technology Stack aggregates those raw per-application records; it does not run its own scan.
Only live assets count. Every metric, count, and list on this page is restricted to web applications whose status is New, Open, or Reopened. Technologies attached only to Closed applications are excluded — so when an app is retired and closed, its technologies stop inflating your inventory. (Closed apps are still used internally to compute the removed count.)
Counts are distinct, not row sums. For a given technology:
- Assets =
COUNT(DISTINCT application_id)— the number of distinct live web applications it was found on. - IPs =
COUNT(DISTINCT ip)— distinct host IPs behind those applications. - Versions = distinct, non-empty version strings detected.
- Unversioned = the number of detections where no version could be determined.
Because counts are deduplicated, the Assets number for a technology will not equal the sum of its per-version asset counts if the same asset reports the technology twice.
Categories are computed, not stored. ShadowMap does not store a category on each technology. Instead, the category is derived at query time by matching the technology name against a built-in keyword map. There are 17 categories — Web Server, CDN, CMS, Framework, Language, Analytics, Security, Video, Font, Hosting, Load Balancer, Email, Database, Cache, JavaScript, Ecommerce, API — plus Other for anything that matches none of them. Matching is first-match-wins in map order, so a name that could fit two buckets lands in the first one it matches.
Short names are matched as whole words
For keyword tokens of three characters or fewer (for example iis, cdn, f5, csp), the classifier requires a whole-word match rather than a substring match. This prevents a short token from accidentally tagging an unrelated technology whose name merely contains those letters.
"New (7 days)" means first detected in the last week. A technology row is flagged NEW, and counted in the New (7 days) metric, when its earliest detection (first_seen) is within the last 7 days. This is your shadow-IT and unauthorized-deployment signal: a technology that was not on your attack surface a week ago and now is. Internally ShadowMap also tracks a removed count — technologies that now appear only on recently-closed applications and are absent from the live set — though that figure is not surfaced as a card on the list page.
The Relevance column. Technology Stack reuses ShadowMap's shared 0–100 relevance scoring component (the same badge used across other modules). That score is computed from signals such as severity and recency. Technology rows are aggregates without a severity rating, so in practice the Relevance badge typically renders as a dash (—) here — prioritize instead by Assets, version sprawl, Unversioned count, and the NEW flag.
Understanding the data
Columns
| Column | What it tells you |
|---|---|
| (icon) | The technology's logo; falls back to a generic icon when none is known. |
| Technology | The technology name, its category (sub-label), and a NEW badge if first seen in the last 7 days. |
| Assets | Distinct live web applications running this technology. |
| IPs | Distinct host IPs behind those assets. |
| Versions | Number of distinct versions detected across your estate. A high number means version sprawl — many different builds of the same component in production. |
| Unversioned | Detections where no version could be fingerprinted. Highlighted when greater than zero, because you cannot CVE-match a component you cannot version. |
| Relevance | Shared 0–100 priority badge (see above); usually a dash for technology aggregates. |
| Details | Opens the technology detail view. |
Metrics strip
| Card | Meaning |
|---|---|
| Technologies Detected | Total distinct technologies across live assets. |
| Total Assets | Distinct live web applications that have at least one fingerprinted technology. |
| Unique IPs | Distinct host IPs across those assets. |
| New (7 days) | Technologies first seen in the last 7 days. |
| Unversioned | Technologies with at least one detection that has no version (orange-highlighted). |
Why version sprawl and unversioned counts matter
Vulnerability matching is version-specific. A technology with many versions in production is harder to patch consistently, and an unversioned detection cannot be reliably mapped to a CVE at all. Both are good triage signals for where to tighten fingerprinting or where outdated builds may be hiding.
Filtering & search
Three filter mechanisms stack on top of each other:
- Structured search bar. Build rules against three fields — Technology Name, Category, and Version. Operators include equals/is, contains, does not contain, starts with, ends with, in, and not in. Filter values are populated on demand: open a field and ShadowMap returns the available names, versions, or categories (with counts) that match your current query.
- Category chips. Below the search bar, one chip per category present in your data. Click a chip to scope the table to that category; click again or use Clear to remove it. Category filtering re-uses the same keyword classifier, so "Framework" matches React, Laravel, Django, Bootstrap, and so on.
- Free-text search matches against technology name, description, and website.
Category matching for "Other"
Filtering by Other returns technologies that match none of the 17 category keyword sets — useful for surfacing niche or unrecognized components that the classifier could not bucket.
Sorting
Use the sort dropdown in the page header. Default is Most Assets.
| Option | Sorts by |
|---|---|
| Most Assets / Fewest Assets | Asset count (descending / ascending) |
| Name A–Z / Name Z–A | Technology name |
| Most Versions | Distinct version count |
| Most IPs | Distinct IP count |
The list loads 50 rows at a time and pages in more as you scroll. You can also drive the list from the keyboard: j/↓ and k/↑ move the focused row, Enter opens it, and ? toggles the shortcut help.
Detail view
Open a technology to see its header (name, category, description, vendor website, and CPE identifier when available) and three tabs:
Versions
A per-version breakdown of where the technology is deployed:
| Field | Meaning |
|---|---|
| Version | The detected version, or Unversioned when none could be determined. |
| Assets | Distinct live assets on that version. |
| First Seen / Last Seen | When that version was first and most recently observed. |
| Known CVEs | Count of CVEs associated with that version, shown as a red badge when greater than zero. |
This is the table to use when a vulnerability advisory lands: find the affected version row, read its asset count, and pivot to the affected assets.
Some version-table columns may show a dash
The version breakdown is grouped by version and always populates Version and Assets. The First Seen, Last Seen, and Known CVEs columns depend on data the version rollup does not always carry, so they can render as — even when the version itself is well covered. Use the Affected Assets tab for per-asset last-seen timestamps, and treat the version Assets count as the reliable signal.
Affected Assets
The exact applications running this technology, paged in 25 at a time:
| Field | Meaning |
|---|---|
| Asset | The application host (links out in a new tab). |
| IP | Host IP. |
| Version | Version detected on that asset (or Unversioned). |
| Status | The application's status (New / Open / Reopened). |
| Last Seen | When the technology was last observed on that asset. |
Related Tech
Technologies that co-occur on the same assets as the one you are viewing, ranked by shared assets (the number of assets where both appear). This surfaces the rest of a typical stack — for example, opening a CMS often reveals the web server, CDN, and JavaScript libraries that ship alongside it. Each card links straight to that technology's detail view.
Taking action
- Export. The Export button in the page header queues an asynchronous CSV export that honors your current search, filters, and category selection. The file contains one row per technology with: Technology, Category, Assets, IPs, Versions Detected, Unversioned Assets, Website, CPE, and Description. Use it to feed an SBOM, a patch-planning spreadsheet, or a CMDB reconciliation.
- Analytics. Toggle the analytics panel (header control) to reveal a Categories donut chart and a Top 10 Technologies bar chart (by asset count). The panel state is remembered between visits.
- Pivot to the asset. From the detail view's Affected Assets tab, each host links out so you can inspect the live application directly.
Driving remediation from this page
A practical workflow: sort by Most Assets to find your most widely deployed components, open the highest-blast-radius ones, check the Versions tab against current advisories, and export the filtered list to hand affected hosts to the owning team. The Unversioned column tells you where fingerprinting is incomplete and CVE coverage may be blind.
Common questions
Why does a technology show fewer assets than I expect? Only applications in New, Open, or Reopened status are counted. If an app was closed (retired, no longer reachable), its technologies drop out of these totals. Counts are also deduplicated by distinct application, so multiple detections on the same host count once.
Where do the categories come from? Can I change them? Categories are derived at query time from a built-in keyword map matching the technology name — they are not stored or editable per technology. A technology that matches none of the 17 categories is filed under Other.
Why is the Relevance badge usually a dash? The Relevance column is the shared cross-module priority score, which leans on severity and recency signals. Technology rows are aggregated inventory entries without a severity rating, so the score is typically not calculable and renders as —. Prioritize by Assets, Versions, Unversioned, and the NEW flag instead.
What does the Unversioned number actually mean? It is the count of detections of that technology where the scanner could not determine a version. Those detections cannot be reliably matched to version-specific CVEs, so a high Unversioned count is a coverage gap worth noting.
How fresh is this data? It reflects the most recent web-application scans. The "NEW" badge and the New (7 days) metric specifically flag technologies first detected within the last 7 days.
Is this the same as Network Services? No. Technology Stack is built from web-application fingerprints (the software a site runs). Network Services describes the services exposed on open ports across your hosts. They are complementary views of the same external surface.
Related
- Web Applications — the per-application inventory that Technology Stack aggregates; start here to see an individual site's full profile.
- Vulnerability Overview — once you know which versions you run, pivot here to the vulnerabilities affecting them.
- CVE Feeds — track newly published CVEs, then return to Technology Stack to find which assets run the affected component and version.
- Network Services — the port-and-service view of your external surface; complements the web-app technology view.
- Open Ports — the exposed ports underpinning the services and applications fingerprinted here.