Subdomains
The Subdomains view is the working inventory of every hostname ShadowMap has discovered under your domains. Subdomains are where most of the real attack surface lives — each one can host an application, expose a service, or be vulnerable to takeover. This page lists them all with live reachability status, hosting attribution, and inline counts of the apps, open ports, and alerts attached to each.
Overview
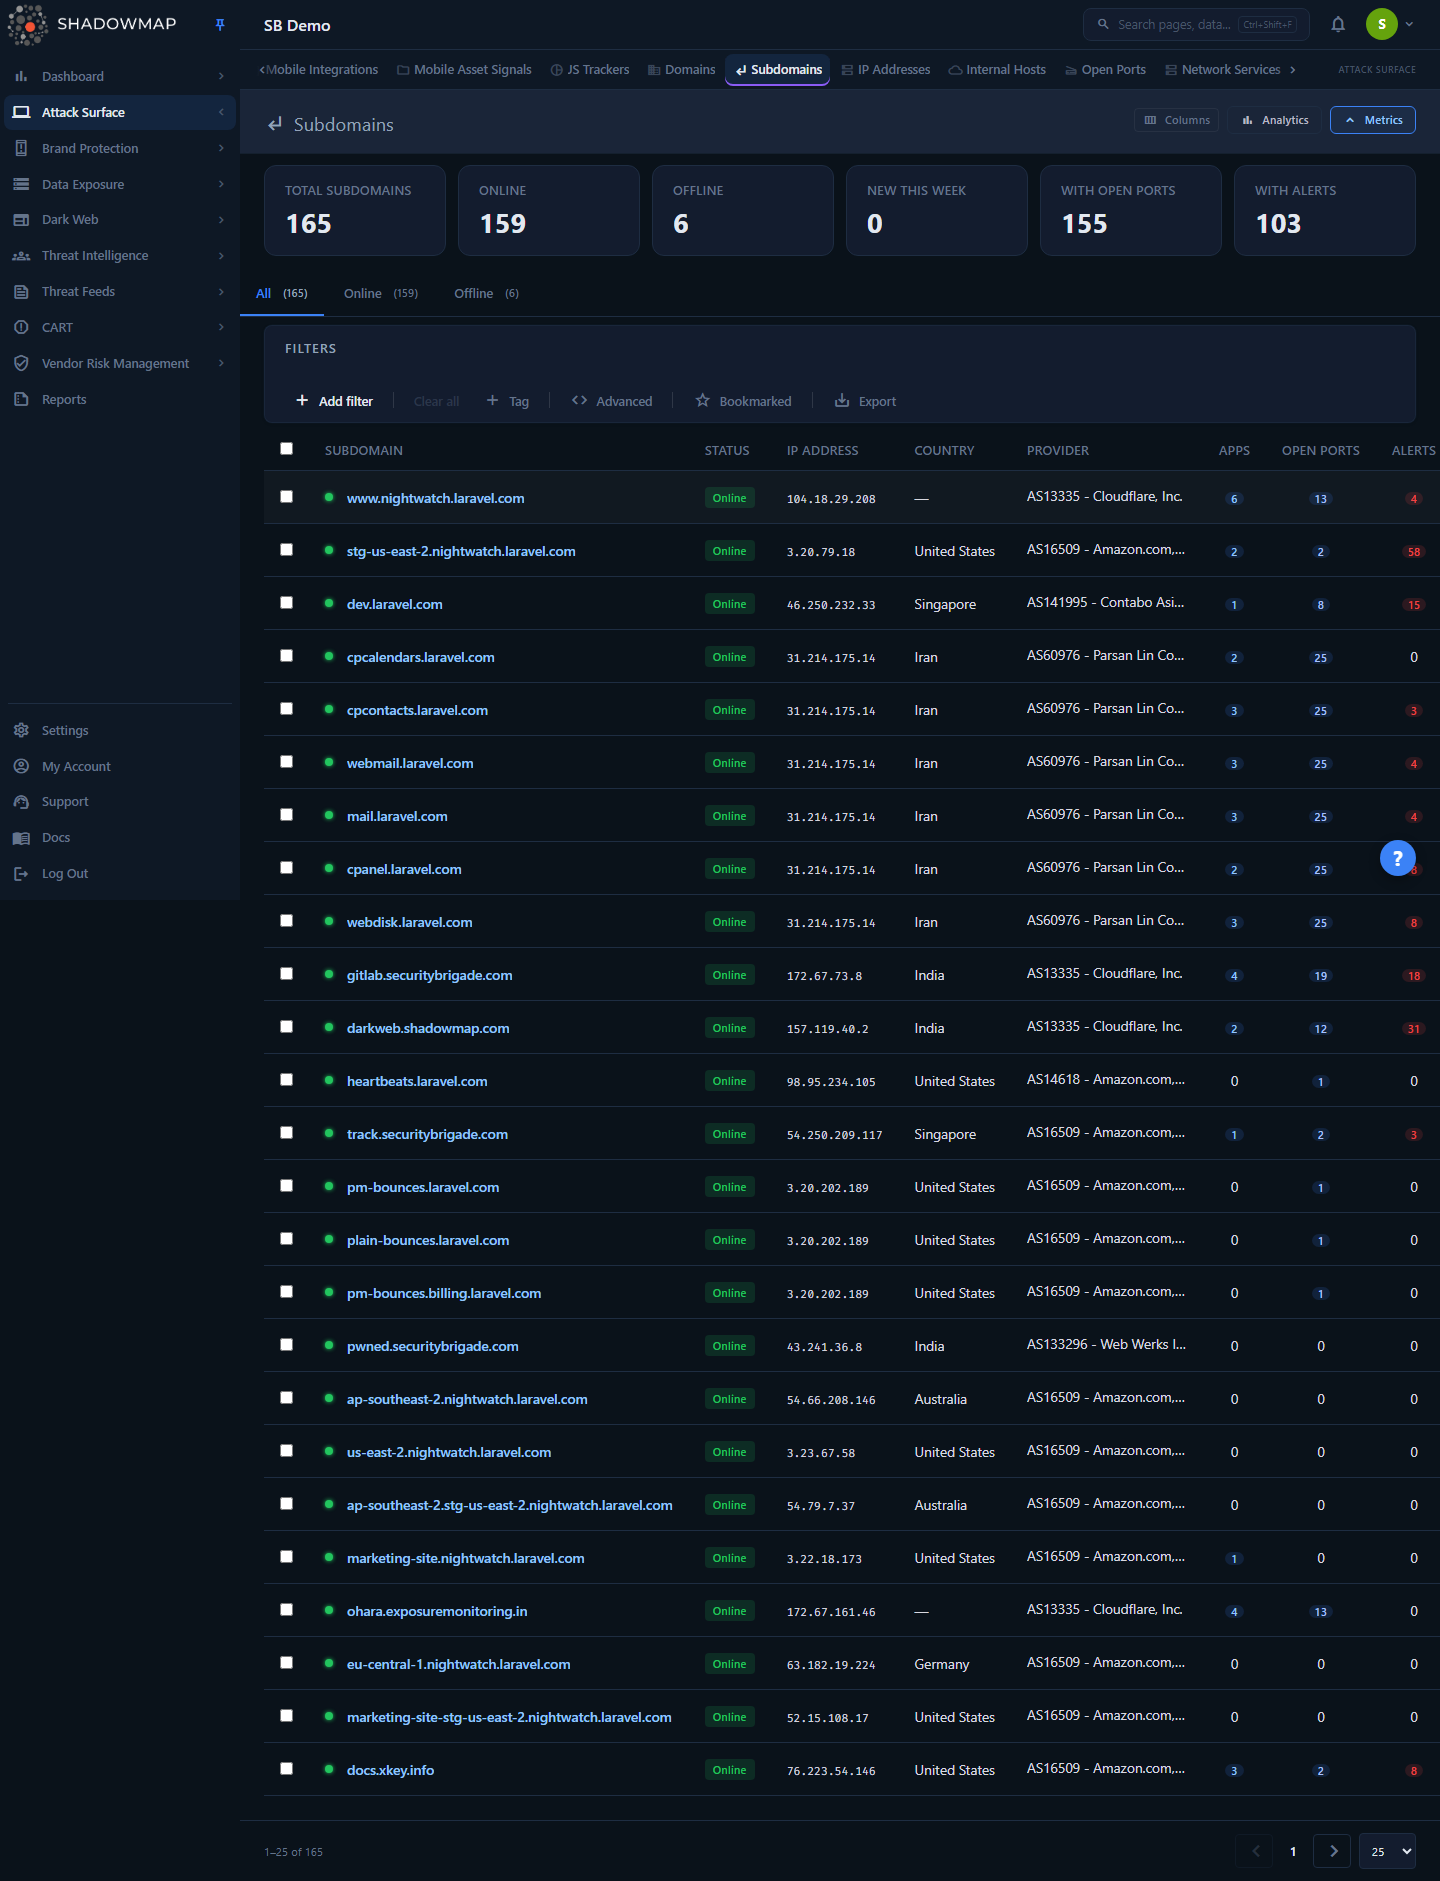
The page opens on the All tab at /asset-inventory/subdomains/all. From top to bottom you get:
- A metrics strip of six KPI cards summarizing your subdomain posture.
- An analytics panel with a 30-day discovery trend, status breakdown, and top countries/providers (toggle it from the header).
- Status tabs — All, Online, Offline — each showing a live count.
- A filter bar for narrowing the list, plus a Bookmarked toggle and Export.
- The subdomain table, one row per unique subdomain, with sortable columns and inline action buttons.
Click any row to open the detail drawer; click the expand icon (or a subdomain on the full detail route) to open the full detail page with Applications, Open Ports, Threat Exposure, and Data Exposure.
Access requires the Asset Inventory read permission. Users without it will not see the Asset Inventory section.
How it works
These are the mechanics behind the list that you can't infer from the UI.
How subdomains are discovered
ShadowMap discovers subdomains continuously, without any input from you, using several techniques in parallel:
- DNS enumeration against your root domains (from the Domains inventory).
- Certificate Transparency (CT) log monitoring — every TLS certificate issued for a hostname under your domains shows up in public CT logs, which ShadowMap watches.
- Web crawling — links and redirects found while crawling your sites surface additional hostnames.
A newly created subdomain is typically detected within hours of its certificate being issued or its DNS record appearing. You do not add subdomains manually; the inventory is built from what is observable on the internet.
One row per subdomain, not per IP
A single subdomain can resolve to several IPs over time (load balancers, CDNs, blue/green deployments), and ShadowMap may hold multiple raw observation rows for it. The list groups by subdomain name and shows one row per unique hostname. The grouped row's IP, country, provider, and "last seen" reflect the most recent observation.
This grouping is why the Status is derived as MAX(status) across all of a subdomain's observations: if any observation is Online, the subdomain is reported Online. A subdomain only shows Offline when none of its observations currently resolve and respond. This prevents a single stale offline row from hiding a subdomain that is in fact live.
Online vs Offline
| Status | Meaning |
|---|---|
| Online | The subdomain currently resolves via DNS and responds. It is a live, reachable part of your attack surface. |
| Offline | The subdomain no longer resolves or responds on any tracked IP. It may be decommissioned — or it may be a dangling DNS record (a takeover risk, see below). |
Offline does not mean "safe to ignore." An Offline subdomain whose DNS still points at a cloud provider with no application behind it is a classic subdomain takeover candidate.
Where the inline counts come from
The Apps, Open Ports, and Alerts columns are correlated from other modules at query time, not stored on the subdomain:
| Column | Source | Matched by |
|---|---|---|
| Apps | Web applications inventory | host = subdomain name |
| Open Ports | Summarized open ports | ip = the subdomain's resolved IP |
| Alerts | Alerts module | host = subdomain name |
Because Open Ports are keyed by IP, a subdomain with no resolved IP shows 0 ports even if the underlying host has services. Apps and Alerts are keyed by hostname.
Each count is a clickable pivot — see Pivoting to related modules.
The Relevance score
The Relevance column is a normalized 0–100 priority score computed per row in the application layer (it is not stored in the database). The score is a weighted average of whichever scoring signals a row actually carries. For a subdomain in this list the only signal present is recency: a linear freshness decay where today's last-seen date scores 1.0 and a one-year-old observation scores 0. So in practice the Relevance score here is a freshness indicator — the more recently a subdomain was confirmed, the higher it scores. Use it as a tie-breaker for prioritization, not as an absolute risk rating.
INFO
The Relevance score is a per-row display indicator computed when each page of results is returned. It is meant for at-a-glance prioritization within the rows you're viewing; for ordering the full inventory, sort by Last Seen instead.
Understanding the data
Columns
Every column except Subdomain can be hidden or shown from the column customizer in the page header. Subdomain is locked.
| Column | Description |
|---|---|
| Subdomain | The fully-qualified hostname (e.g. staging.api.example.com). A colored status dot precedes it — green for Online, red for Offline. Always visible. |
| Status | Online or Offline (see Online vs Offline). |
| IP Address | The IP the subdomain most recently resolved to. — if unresolved. |
| Country | Geographic location of the hosting infrastructure. |
| Provider | The ASN / hosting provider (e.g. AWS, Cloudflare, DigitalOcean). |
| Apps | Number of web applications hosted on this subdomain. Click to pivot to Web Applications. |
| Open Ports | Number of open ports detected on this subdomain's IP. Click to pivot to Open Ports. |
| Alerts | Number of security alerts tied to this subdomain. Click to pivot to Alerts. |
| Relevance | 0–100 freshness-based priority score (see The Relevance score). |
| First Seen | When ShadowMap first discovered this subdomain. |
| Last Seen | The most recent scan that confirmed the subdomain still exists. |
The default visible set is Subdomain, Status, IP Address, Country, Provider, Apps, Open Ports, Alerts, Relevance, and Last Seen. First Seen is available but hidden by default.
Click any column header to sort. Sort is server-side and respects the grouping (e.g. sorting by Last Seen uses the most recent observation per subdomain). The default sort is Last Seen, descending, so the most recently confirmed subdomains surface first.
Metrics strip
Six cards summarize the filtered population. Clicking a clickable card applies the matching quick filter.
| Card | What it counts | Clickable |
|---|---|---|
| Total Subdomains | All unique subdomains | Yes — resets to All |
| Online | Subdomains reporting Online | Yes — filters to Online |
| Offline | Subdomains reporting Offline | Yes — filters to Offline |
| New This Week | Subdomains first discovered in the last 7 days | Yes — filters First Seen ≥ 7 days ago |
| With Open Ports | Subdomains whose IP has at least one open port | No (informational only) |
| With Alerts | Subdomains with at least one alert | No (informational only) |
Why two cards are not clickable
"With Open Ports" and "With Alerts" are derived from correlated subqueries against other modules, and the subdomains list has no filterable column for them. Rather than route to an unfiltered list that wouldn't match the number, those cards are display-only.
Analytics panel
Toggle the analytics panel from the page header. It shows:
- Discovery Trend (30 days) — a line chart of newly discovered subdomains per day. A sudden spike often means a new product launch, an acquisition, or shadow IT coming online.
- Status — a donut of Online vs Offline.
- Top Countries — ranked hosting locations.
- Top Providers — ranked ASNs / hosting providers. Useful for spotting assets on providers your organization doesn't officially use.
Filtering & search
The filter bar supports building rules (with AND/OR conditions) across these fields:
| Filter | Notes |
|---|---|
| Subdomain | Full or partial hostname match. |
| IP Address | Filter by resolved IP. |
| Status | Online or Offline. |
| Country | Hosting country. |
| City | City-level geolocation. |
| Provider | ASN / hosting provider. |
| Tag | Custom tags (shared with the Domains module). |
| Bookmarked | Restrict to your bookmarks. |
| First Seen | Date filter on discovery date. |
| Last Seen | Date filter on last-confirmed date. |
Two extra controls sit at the end of the filter bar:
- Bookmarked toggle — a one-click star filter that shows only subdomains you've bookmarked.
- Export — see Taking action.
Combining filters lets you answer real questions directly, for example:
- Offline subdomains on a cloud provider (status = Offline, provider = AWS/Azure/etc.) — a shortlist of takeover candidates.
- Subdomains hosted outside your primary cloud (provider ≠ your standard) — a shadow-IT indicator.
- New subdomains this week with open ports — newly exposed services to triage immediately.
Detail view
Clicking a row opens a detail drawer on the right; the expand icon opens the full detail page. Use the up/down arrows (or j/k) to move between subdomains without leaving the drawer.
Detail drawer
A compact summary: the subdomain name, an Online/Offline status badge, the core fields (IP, Country, City, Provider, First Seen, Last Seen), an Exposure Summary with Applications / Open Ports / Alerts counts, and quick Bookmark and Share actions.
Detail page
The full page (header + four tabs) aggregates everything ShadowMap knows about the subdomain:
- Overview — two tables:
- Applications: web apps on this subdomain with host, port, protocol, a risk badge (High / Medium / Low / Info), and last seen. Rows link to the application's detail page.
- Open Ports: ports detected on the subdomain's IP, with service, product, and version.
- Threat Exposure — derived from the technology stack detected on the subdomain. Shows a metrics row (Technologies, Matching CVEs, Critical, KEV, Threat Actors) and:
- Detected Technologies — each tagged as App- or Network-sourced.
- Matching CVEs — CVE ID, CVSS score, severity, a KEV badge for Known Exploited Vulnerabilities, the affected product, and linked threat actors. Rows open the CVE detail.
- Data Exposure — credential/breach exposure tied to this subdomain:
- Stealer Logs — entries where this subdomain appears in info-stealer malware logs (credentials harvested from infected machines).
- Data Breaches — breach records matching this subdomain's base domain.
- Activity — comments thread for collaboration and audit notes.
TIP
A subdomain in the Stealer Logs or Data Breaches tab means credentials for an app on that host have likely been exposed. Cross-reference with Stealer Logs and Data Breaches for the full context.
Taking action
Pivoting to related modules
The Apps, Open Ports, and Alerts counts are clickable. Clicking them opens the relevant module pre-filtered to this subdomain:
- Apps → Web Applications filtered to the subdomain's host.
- Open Ports → Open Ports filtered to the subdomain's IP.
- Alerts → Alerts (Needs Review) filtered to the subdomain's host.
In the detail drawer/page, the IP also links to the IP Addresses view filtered to that IP.
Bookmarking
Star any subdomain (row action, drawer, or detail page) to bookmark it for yourself. Use the Bookmarked toggle in the filter bar to focus on your saved set. Bookmarks are per-user.
Comments
Add comments to a subdomain from the row's comment icon or the Activity tab on the detail page. Comment templates (shared platform-wide) speed up recurring notes.
Bulk actions
Select rows with the checkboxes to reveal the bulk action bar:
- Bookmark — bookmark all selected subdomains at once.
- Share — open the share/integration modal for the selection (push to a connected ticketing/chat integration).
Exporting
Click Export to download an .xlsx of subdomains matching your current filters, sort, and search. The export honors the applied filter rules (including OR-joined conditions) so the file matches what you see on screen.
Common questions
Why does a subdomain I decommissioned still show as Online? Status reflects the most recent scan. If any tracked IP for that hostname still resolves and responds, it reports Online. Confirm DNS has actually been removed; if the record is gone it will flip to Offline on the next scan.
A subdomain shows Offline but I'm sure it's gone — should I do anything? Yes. Check whether its DNS record still points at a cloud service (S3, Azure App Service, Heroku, etc.) with nothing behind it. That's a dangling record an attacker could claim. Filter for Offline subdomains on cloud providers to build a takeover-candidate list.
What is a subdomain takeover and how do I spot one? When a subdomain's DNS (often a CNAME) points to a decommissioned cloud resource, an attacker can re-provision that resource and serve content under your domain. Watch for Offline subdomains where the Provider is a cloud platform but no application responds. The Alerts module raises findings for confirmed cases.
Why does the Open Ports count show 0 when I know there are services running? Open Ports are matched by the subdomain's resolved IP. If the subdomain currently has no resolved IP (unresolved, or behind a proxy that hides the origin), there's nothing to correlate ports against. Apps and Alerts are matched by hostname and are unaffected.
Why don't the "With Open Ports" and "With Alerts" cards filter the list when I click them? They are informational only. Both counts come from correlated subqueries against other modules, and the subdomains list doesn't expose a filterable column for them, so clicking would route to a list that wouldn't match the number.
The Online tab count and the Online metric card — are they the same number? Yes. Both run through the same grouped-subdomain logic (one row per hostname, status derived as MAX(status)), so the tab count and the card always agree.
How fresh is this list? Subdomains are re-confirmed on each scan; the Last Seen column shows when each was last seen. New subdomains usually appear within hours of their certificate or DNS record going live.
Related
- Domains — the root domains these subdomains belong to.
- IP Addresses — the IPs these subdomains resolve to.
- Web Applications — applications hosted on your subdomains (the Apps count pivots here).
- Open Ports — services exposed on your subdomains' IPs (the Open Ports count pivots here).
- Alerts — security findings tied to your subdomains, including takeover detections (the Alerts count pivots here).
- Vulnerability Overview — CVEs matched to the technologies detected on your subdomains.
- Stealer Logs and Data Breaches — credential exposure surfaced in a subdomain's Data Exposure tab.