VRM Overview
The VRM Overview is the landing page of Vendor Risk Management. Instead of inspecting one supplier at a time, it rolls your entire vendor portfolio into a single screen: how each vendor's security score is trending, which vendors changed the most this period, and where third-party exposure is showing up right now across dark-web breaches, phishing, and high-risk vulnerabilities.
Overview
The page is a grid of widgets, each summarizing one dimension of third-party risk across the vendors in scope:
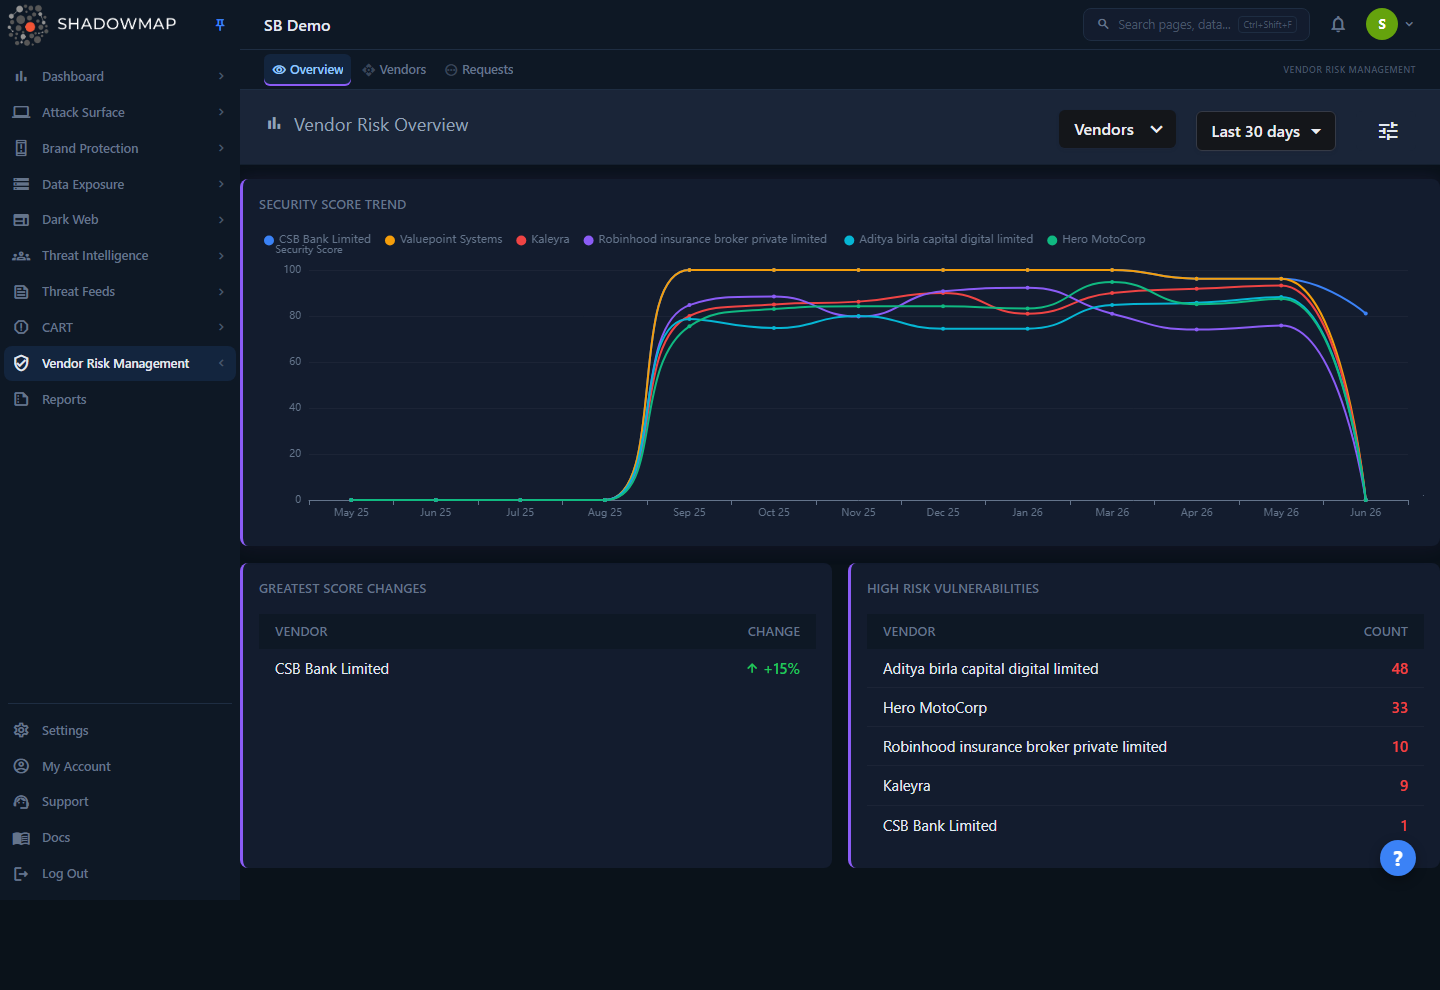
- Security Score Trend — a multi-line chart of each vendor's security score over roughly the last 13 months.
- Greatest Score Changes — the vendors whose score moved the most over the selected window, up or down.
- High Risk Vulnerabilities — count of high-risk vulnerabilities per vendor.
- Dark Web Exposure — dark-web breach mentions tied to your vendors, grouped by date and breach type.
- Users Compromised — count of compromised user records (data breaches) per vendor.
- Phishing Pages — count of phishing pages impersonating each vendor.
- Common Vulnerabilities Across Vendors — vulnerabilities that affect more than one of your vendors, and how many each affects.
- Recent Activity Feed — a chronological stream of everything new across all vendors (breaches, dark-web chatter, Telegram, phishing, and alerts).
Two controls in the page header drive every widget: a Vendors multi-select filter (scope the dashboard to specific suppliers or leave it on all) and a date-range dropdown. An administrator also sees a settings (tune) button that jumps to the VRM email-alert preferences.
Most of the count-based widgets are clickable — selecting a row opens a drill-down panel listing the underlying findings for that vendor.
How it works
These are the mechanics you cannot read off the screen.
The security score is the same one you get for your own organization
Every vendor on this page is assessed with the identical external attack-surface methodology ShadowMap runs against your own company. ShadowMap maps the vendor's internet-facing footprint, scores it across the standard security categories, and rolls those into a single 0–100 score (higher is better). That score — not a survey or questionnaire — is what the Score Trend and Greatest Changes widgets plot. See Security Rating for how the categories combine, and the scoring algorithm for the math.
Because scores are derived from scans, a vendor's score only changes when a new scan completes for that vendor. Between scans the number is static, which is why the trend chart is sampled monthly rather than continuously.
How the Score Trend chart is built
The chart samples each vendor's score at roughly monthly intervals going back 13 data points (about 13 months). For each month it takes the average score recorded for that vendor in that period and plots it as one point; the line connects those points. The y-axis is fixed to the full 0–100 range so vendors are visually comparable, and the x-axis is labeled by month (e.g. Jun 25).
Eight-line cap
The chart renders at most eight vendor lines even if your filter selects more. With a large portfolio, narrow the Vendors filter to the suppliers you want to compare so the chart stays readable and shows the lines you care about.
How "Greatest Score Changes" is calculated
For each vendor, ShadowMap takes the average score recorded most recently (the current snapshot) and the average score from the start of the selected window (e.g. 7 or 30 days ago), then reports the difference as a signed percentage:
change = previous_period_average − recent_averageA vendor that has data only in the recent period (no comparison point at the start of the window) is shown with its current score and no delta. With the date range set to Today, the widget simply shows the vendor's current average score rather than a change. The arrow and color reflect direction, not severity — read it as "which vendors are moving, and which way."
What each exposure widget counts
The exposure widgets pull from the same threat sources as the rest of ShadowMap, but scoped to your vendors' assets rather than your own:
| Widget | Source | What the count means |
|---|---|---|
| High Risk Vulnerabilities | Alerts / vulnerability findings | High-risk vulnerabilities open on the vendor's surface in the window |
| Dark Web Exposure | Dark-web data-breach mentions | Breach mentions tied to the vendor, grouped by date and breach type |
| Users Compromised | Data breaches | Compromised user records attributed to the vendor's domains |
| Phishing Pages | Phishing / impersonation | Phishing pages targeting or impersonating the vendor |
| Common Vulnerabilities | Alerts / vulnerability findings | Vulnerabilities appearing across more than one of your vendors |
Each widget honors both the Vendors filter and the date range. A vendor with zero findings in a widget is omitted from that widget rather than shown as a zero row.
Why "Common Vulnerabilities" matters
This widget inverts the others. Instead of "how exposed is each vendor," it asks "which weaknesses are shared across my supply chain." A vulnerability that lights up here affects several of your vendors at once — a single CVE, a vulnerable shared technology, or a common misconfiguration — which usually means a higher-leverage remediation conversation and, often, a systemic supplier risk rather than a one-off.
The Recent Activity Feed merges five sources
The activity feed is not a single table. It merges five independent vendor-scoped streams into one timeline, grouped by date → finding type → vendor:
- Dark-web breach mentions (data breaches)
- Dark-web forum discussions
- Telegram channel messages
- Phishing / impersonation URLs
- Alerts
This is the fastest way to see "what's new across all my vendors" without opening each one. Newest dates appear first.
Caching and freshness
Several widgets — Greatest Changes, Dark Web Exposure, and Users Compromised — are cached for about 10 minutes per company and date range for performance. The cache is keyed on the selected date range, so re-selecting the same range shortly after may return the cached result. Underlying findings update on the normal scan and ingestion cadence, not on page refresh.
Vendor-role users see a scoped view
If you are signed in as a vendor (a supplier given access to their own ShadowMap data) rather than a customer, the Vendors filter is hidden and the dashboard is automatically scoped to your own organization. Customer users see the full multi-vendor portfolio.
Filtering & the date range
| Control | Options | Effect |
|---|---|---|
| Vendors filter | Multi-select of your tracked vendors | Limits every widget to the selected vendors; empty = all vendors |
| Date range | Today, Last 7 days, Last 30 days, This Year | Sets the window for trends, changes, and exposure counts |
The default date range is Last 30 days. Changing either control reloads all widgets together.
Deep-link a vendor selection
The dashboard reads a vendor selection from the URL, so you can bookmark or share a link that opens the overview pre-filtered to a specific vendor or set of vendors.
Drilling into a finding
The count-based widgets — High Risk Vulnerabilities, Dark Web Exposure, Users Compromised, Phishing Pages, and each row of the Recent Activity Feed — are interactive:
- Click the count or the row to open a drill-down panel listing the individual findings behind that number (for example, the actual breached records, phishing URLs, or vulnerability entries) for that vendor and finding type, scoped to the current date range. The panel header shows the vendor name, the finding type, and the item count, and the table columns adapt to the finding type.
- Click the vendor name (rendered as a link) to leave the dashboard and open that vendor's full detail page, where you get the per-category score breakdown and complete findings list.
Drill-down vs. detail page
The drill-down panel is a quick, in-place look at one widget's findings for one vendor. The vendor detail page is the full record — every category, score history, findings, comments, and bookmarking — for that vendor.
Email alert preferences
Administrators see a settings (tune) button in the page header. It opens the VRM section of Global Settings, where you configure who is notified — and about what — when vendor exposure changes. This is how you turn the overview from a screen you check into alerts that reach you. Non-admin users do not see this button.
Common questions
Why is a vendor missing from the Score Trend chart? The chart caps at eight lines. If your filter selects more than eight vendors, only eight are drawn. Narrow the Vendors filter to see a specific supplier. A vendor with no recorded scores in the period also won't appear.
A vendor shows a big score change but I didn't change anything — why? Scores change only when a new scan of that vendor completes. A large move in Greatest Score Changes means the most recent scan found materially more (or fewer) issues than the prior period — for example, a newly exposed service, a fixed vulnerability, or a fresh breach.
Greatest Score Changes shows the score itself, not a change. Why? With the date range set to Today, or when there is no earlier snapshot to compare against in the window, the widget falls back to showing the vendor's current average score rather than a delta.
Why does a count here differ from the vendor's detail page? The overview counts are scoped to the selected date range and several widgets are cached for about 10 minutes per date range. The detail page reflects the vendor's full current state. A mismatch usually means the date window excludes older findings, or you're seeing a cached overview result.
The dashboard is empty or sparse — is something broken? Most likely you have few or no vendors added yet, or the selected window is short. Add vendors from the Vendor List, and widen the date range. Each widget fails independently, so an empty widget reflects no findings for that source, not a page error.
Can a vendor see other vendors' data? No. A user with the vendor role is automatically scoped to their own organization and never sees the multi-vendor filter or other vendors' findings.
Related
- Vendor List — the directory of every vendor you track, each scored and graded; add, filter, and rank vendors here.
- Vendor Detail — the per-vendor deep dive the dashboard links into: category scores, findings, comments, and history.
- Vendor Requests — request that a new vendor be onboarded or an existing vendor's scope changed.
- Security Rating — the same 0–100 scoring methodology applied to your own organization, and the source of the vendor scores shown here.
- Scoring algorithm — exactly how category scores combine into the headline number.
- Data Breaches and Phishing URLs — the same finding types as the exposure widgets, for your own organization.
- Global Settings — where administrators configure VRM email-alert preferences.