Pipeline Notifications
Pipeline Notifications is an administrator-only operations dashboard that surfaces events the back-end data pipeline pushes into ShadowMap. It is where an admin sees pipeline-quality signals — for example, a scan that produced records the ingestion layer had to sanitize — that are relevant to running the platform but are not customer-facing findings.
This is not your notification preferences
This page is distinct from Account Notifications, where you configure which alerts and reports you personally receive. Pipeline Notifications is a read-only operations feed; it does not control email, Slack, or any delivery channel. If you came here to turn alerts on or off, go to Account Notifications instead.
Overview
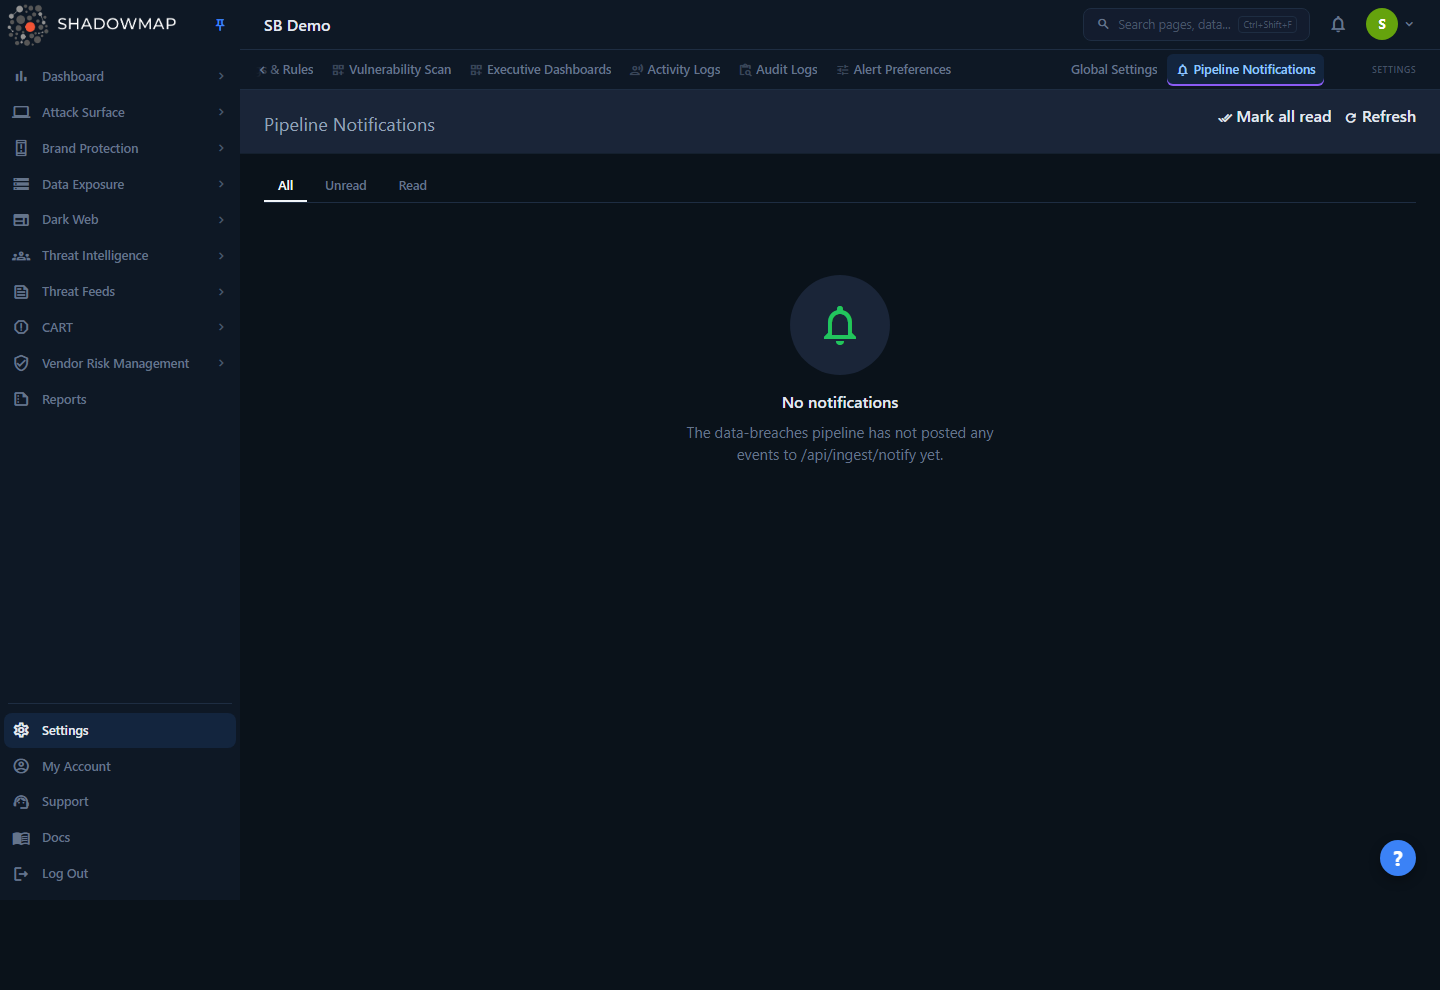
The page is a single paginated table of pipeline events scoped to the current company (tenant), newest first. Each row is one event the pipeline emitted: a severity, a machine-readable kind, a human summary, the source module that raised it, and when it arrived. Unread rows are highlighted and carry a dot in the leftmost column; you mark them read individually or clear them all at once.
It lives in the left navigation under Settings, in the Administration group, and only appears for users with the Administrator role. The route is /notifications. A legacy breadcrumb path, /notifications/dashboard, redirects here so old bookmarks keep working.
Administrator-only
Both the page and its data APIs are gated server-side on the administrator role. Non-admins do not see the nav item and cannot reach the endpoints — the content describes pipeline internals, not findings the broader team needs.
How it works
The mechanics here are mostly invisible in the UI, so they are worth spelling out.
Where the events come from
ShadowMap's back-end pipeline (the data-breaches ingestion service) pushes events to the dashboard over a server-to-server HTTP call: POST /api/ingest/notify. That endpoint is not a user session — it is authenticated with a shared secret sent in an X-Ingest-Secret header, compared in constant time. If the secret is not configured on the server, the endpoint fails closed (returns an error and accepts nothing), so notifications are never silently dropped or silently accepted from an unauthenticated caller.
Each accepted event is validated against a fixed contract and written as one row to a notifications table:
| Field | Meaning |
|---|---|
company_id | The tenant the event belongs to. Required — every event is scoped to one customer. |
kind | A machine-readable discriminator, e.g. scan_sanitization_errors. |
severity | Optional raw severity string, normalized on the way in (see below). |
finding_id | Optional pointer to a specific finding row, for finding-level events. |
summary | Optional human-readable one-liner, truncated to 200 characters by the sender. |
source_module | Optional dotted path identifying the emitter, e.g. breach_fetcher.scan_summary. |
Audience routing (why you only see "ops" events)
One table serves two audiences — ops (internal operations) and customer — and the audience is derived from the event's kind at write time, not chosen by the caller. This page only ever shows ops-audience events. Customer-audience events are routed elsewhere and never appear here.
Today the live ops kind is scan_sanitization_errors, raised by the pipeline's scan-summary step when a scan produced data that had to be cleaned during ingestion. The known customer-audience kind, card_bin_match (raised when a freshly ingested stealer-log payment card matches a corporate BIN you configured), is deliberately excluded from this view — it is a tenant-facing signal, not an operations one. As the pipeline adds new event kinds, the routing table decides which surface each one lands on; ops kinds show up here automatically with no further configuration.
Severity normalization
Senders are inconsistent about severity casing and vocabulary, so the back end collapses raw values to a stable set before storing them:
| Raw value(s) sent | Stored / displayed as | Badge color |
|---|---|---|
Critical, critical | critical | Red |
high | high | Red |
warning, medium | warning | Amber |
info, low | info | Blue |
empty string or null | (no severity) | Muted / em dash |
| anything else | lowercased as-is | Muted |
A blank or missing severity is preserved as "no severity" rather than coerced to a default, and renders as an em dash (—) in the table.
Multi-tenant scoping
Every query — the list, the unread count, mark-one-read, and mark-all-read — is scoped to the company you are currently viewing. An admin who switches between tenants sees only that tenant's events, and cannot mark another tenant's notifications read.
Understanding the data
The table shows the following columns:
| Column | Description |
|---|---|
| (dot) | A filled dot in the first column marks an unread row; the whole row is also subtly highlighted. Read rows show nothing here. |
| Severity | The normalized severity badge (critical, high, warning, info) or an em dash if none was supplied. |
| Kind | The machine-readable event type, shown in monospace (e.g. scan_sanitization_errors). |
| Summary | The human-readable one-line description. Truncated with an ellipsis if long — hover to see the full text via the tooltip. An em dash means no summary was sent. |
| Source | The source_module that emitted the event, in monospace (e.g. breach_fetcher.scan_summary). Em dash if not provided. |
| Received | When the event arrived, shown in your local time. |
| (action) | A Mark read button appears on unread rows only. |
Status tabs
Three tabs filter the list by read state. The page size is 25 rows; a footer shows the current range (for example, "1–25 of 113") and page navigation.
| Tab | Shows |
|---|---|
| All | Every ops event for the current tenant, read and unread. |
| Unread | Only events not yet marked read. This tab also displays a count badge of the total unread. |
| Read | Only events that have been marked read. |
Switching tabs resets you to page 1.
Taking action
This is an operations feed, not a workflow tool — the only actions are acknowledging events.
- Mark read (per row) — Marks a single event read. The row updates immediately; on the Unread tab it drops out of view, and the unread count decrements. Marking an already-read event is harmless (it simply refreshes the read timestamp).
- Mark all read — In the page header. Clears every unread ops event for the current tenant in one call. The button is disabled when there is nothing unread, and shows the pending count, e.g. "Mark all read (12)".
- Refresh — Re-fetches the current tab and page from the server. Use it to pull in events that arrived after you loaded the page.
There is no delete
Events cannot be deleted from this view — only marked read. "Read" is an acknowledgement state, not removal; read events remain available under the Read tab and the All tab for later reference.
Common questions
Is this the same as the bell icon / my email alerts? No. This page does not drive any delivery channel. Per-user alert and report delivery is configured in Account Notifications. Pipeline Notifications is a read-only operations log of events the back-end pipeline pushed in.
Why is my list empty? An empty list means the pipeline has not posted any ops-audience events for this tenant yet. The empty state on the All tab says exactly that. Today the pipeline only emits ops events in specific conditions (such as scan sanitization), so a healthy tenant can legitimately have nothing here.
I'm an admin but I don't see "Pipeline Notifications" in the nav. The item only renders for users with the Administrator role, under the Administration group. If you have admin rights and still don't see it, confirm your role assignment under Members.
A teammate can't open /notifications — is that a bug? No. The page and its APIs are gated on the administrator role server-side. Non-admins are blocked even if they navigate directly to the URL. This is by design — the events describe pipeline internals, not customer findings.
What does scan_sanitization_errors mean? It is raised by the ingestion pipeline's scan-summary step when a completed scan produced records that had to be cleaned or corrected during ingestion. It is a data-quality signal for operators, not an indication that a customer asset is at risk. Investigate it the way you would any pipeline-health alert.
Why does a row show an em dash for severity or summary? The sender supplied no value for that field (or an empty one). Severity and summary are optional in the ingest contract; the dashboard preserves "no value" rather than inventing a default.
Can I see customer-facing notifications here? No. Events whose kind routes to the customer audience (for example, a corporate-BIN card match) are intentionally excluded from this page. This view is strictly the ops audience.
Related
- Account Notifications — where you, as an individual user, choose which alerts and scheduled reports you receive and through which channels. This is almost certainly what you want if you're managing your own notifications rather than auditing pipeline health.
- Members — manage who holds the Administrator role that grants access to this page.
- Activity Logs and Audit Logs — other administration views for tracing what happened in the platform, complementary to the pipeline-event feed here.
- Data Breaches — the customer-facing module fed by the same back-end ingestion pipeline that emits the events shown on this page.