Vulnerability Overview
Vulnerability Overview collapses your raw alert stream into one row per distinct vulnerability, so you triage a weakness once instead of chasing it host by host. Each row shows how many assets are affected, the risk level, and whether the count is climbing or falling — the view a vulnerability manager needs to decide what to patch this week.
Overview
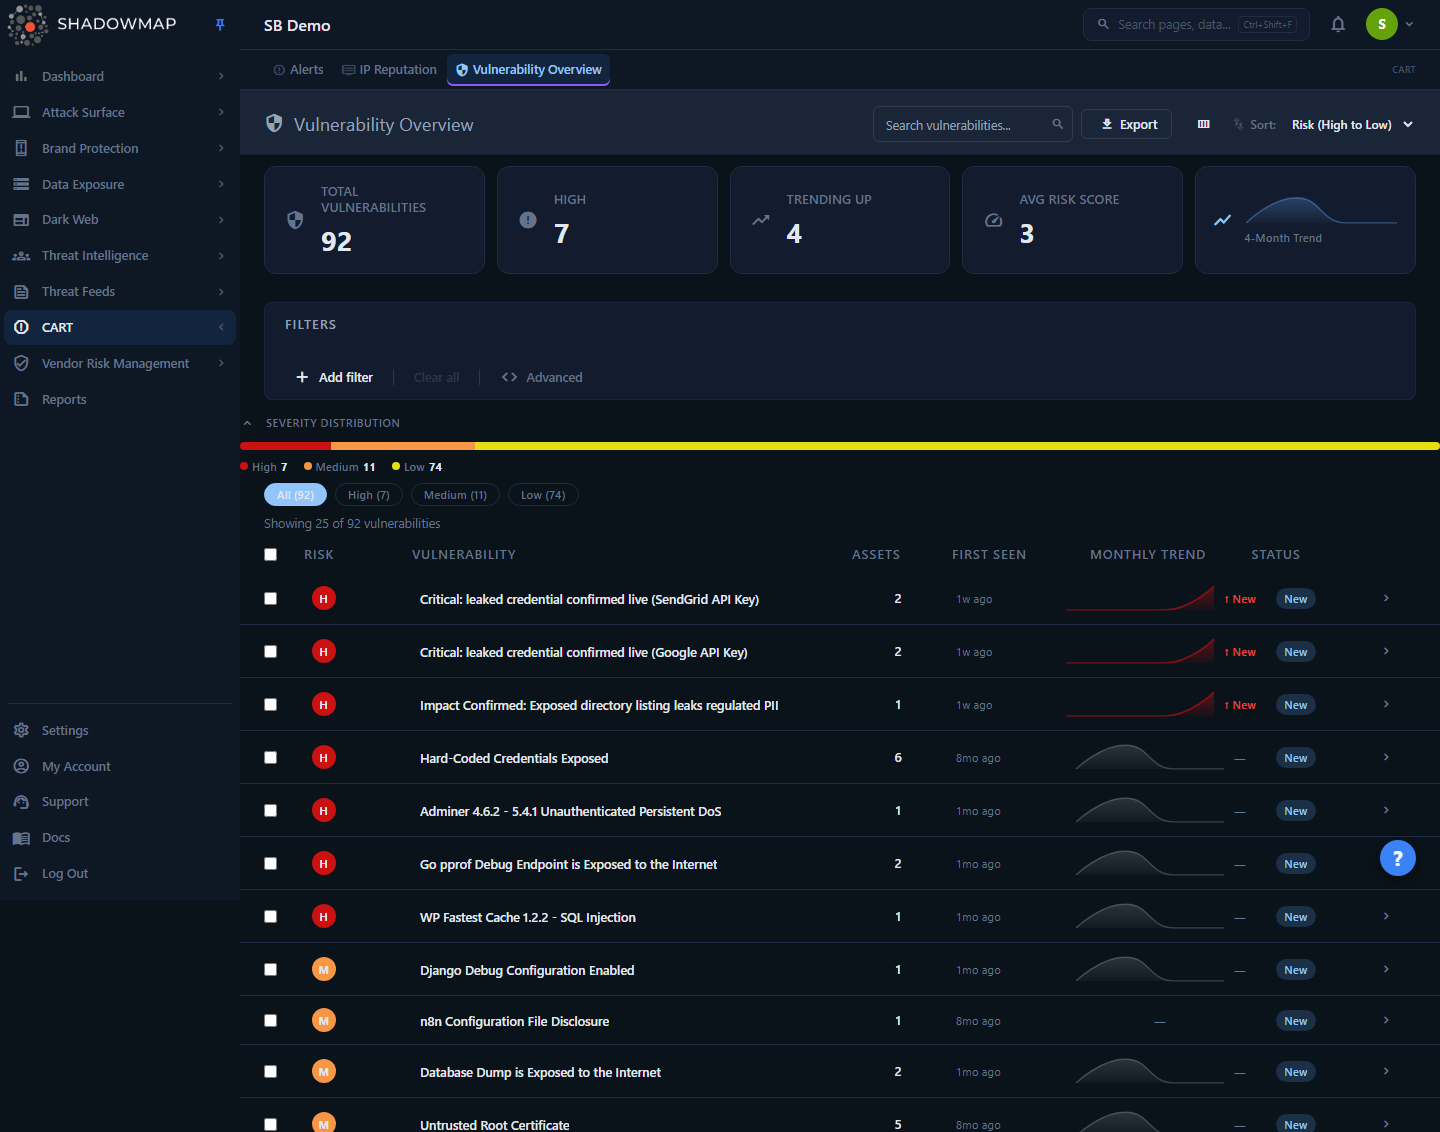
The page opens on the list view. From top to bottom you get:
- A metrics strip of five cards: Total Vulnerabilities, High, Trending Up, Avg Risk Score, and a 4-month trend sparkline.
- A filter bar (FQP pills) for narrowing by title, risk, status, source, country, CVE ID, or first-seen date.
- A Severity Distribution bar plus quick-filter severity chips (All / High / Medium / Low).
- The vulnerability table itself — one row per unique finding title, with risk badge, affected-asset count, first-seen, a monthly-trend sparkline, and a status pill.
Clicking any row opens the detail page for that vulnerability: solution guidance, the affected-asset list, and a 6-month trend chart.
Where the data comes from
Vulnerability Overview is a lens over the Alerts dataset — it does not run its own scans. Every row is an aggregation of the same alerts you see in Alerts, grouped by the finding title. If a vulnerability does not appear here, no alert carries that title for your account under the current filters.
How it works
The mechanics below are not visible from the UI but determine exactly what you see.
One row per title
The backend groups all of your alerts by their title field (GROUP BY title). Every alert sharing a title — e.g. "TLS 1.0 Enabled", "Apache Server Status Page Exposed", a specific CVE — becomes a single vulnerability row. The Assets column is the count of alerts in that group; the row's Risk is taken from the grouped record's risk score.
This is why the same weakness across 200 hosts shows as one line with 200 assets, rather than 200 separate alerts.
Default scope: active findings only
When you load the page with no filters applied, the backend silently injects a default scope of status IN (new, open). Closed/resolved alerts are excluded by default. This keeps the list focused on work that still needs attention.
The moment you apply any filter, that default is replaced by your filter — so if you build a filter and want to keep closed items out, include a status rule yourself. The severity chips and search box handle this automatically (they always re-assert status IN (new, open)).
Risk scoring and severity bands
Each alert carries a numeric risk score. The badge letter, color, and severity band are derived from that score using fixed thresholds:
| Score | Band | Badge | Color |
|---|---|---|---|
| ≥ 8 | High | H | Red |
| 5–7 | Medium | M | Orange |
| 2–4 | Low | L | Yellow |
| < 2 | Informational | I | Green |
These are the same thresholds used across the Alerts engine, so a vulnerability's band here matches its severity everywhere else in ShadowMap. Avg Risk Score on the metrics strip is the mean numeric score across all distinct vulnerabilities in the current scope (one data point per group, not per asset).
No "Critical" band here
The metrics card and chips top out at High — there is no separate Critical band in this view. The "High" card counts every vulnerability scoring ≥ 8.
Trend math (sparkline and Trending Up)
ShadowMap buckets each vulnerability's alerts by the month they were first seen (added_on), over the trailing four calendar months. The row sparkline plots those four buckets; the trend text compares the current month to the previous month:
- ↑ N% (red) — current month has more new occurrences than last month. More exposure is bad, so up is red.
- ↓ N% (green) — fewer new occurrences than last month.
- ↑ New — first occurrences this month with none last month.
- — — no change, or not enough data.
The Trending Up metric card counts how many distinct vulnerabilities are rising (current > previous, or new this month with a non-zero current count). The 4-month sparkline card in the metrics strip is the aggregate trend across all vulnerabilities combined.
Severity Distribution vs. severity chips
The Severity Distribution bar and the severity chips are both driven by a separate summary query, captured once on load as a stable "landscape." Clicking a chip filters the table to that band but does not redraw the distribution — so the bar keeps showing the full High/Medium/Low/Info breakdown while you drill into one band. The landscape only refreshes when you change the FQP filter pills or run a search.
Sorting
The Sort dropdown offers:
| Option | Orders by |
|---|---|
| Risk (High to Low) | Risk score, highest first (default) |
| Asset Count | Number of affected assets |
| Title (A-Z) | Vulnerability title alphabetically |
Sorting re-queries from the server and resets the scroll position.
Understanding the data
List columns
| Column | What it shows |
|---|---|
| Risk | Severity badge (H/M/L/I), color-coded by score band. |
| Vulnerability | The finding title — the grouping key for the row. |
| Assets | Count of affected assets (alerts in this title group). |
| First Seen | Relative time since the earliest occurrence (e.g. "3 months ago"). |
| Monthly Trend | 4-month sparkline plus the ↑/↓ percentage change vs. last month. |
| Status | Group-level state pill — see below. |
Columns are customizable: the column picker (the view_column icon in the header) lets you show or hide Assets, First Seen, Monthly Trend, and Status. Risk and Vulnerability are always shown. Your selection is saved in the browser (localStorage) and persists across sessions.
Status pill
The list status pill summarizes the whole group:
| Pill | Meaning |
|---|---|
| New | At least one alert in the group is in the new state. |
| Open | No new alerts, but at least one is open. |
| Closed | All alerts in the group are resolved. |
Because the default scope hides closed alerts, you will normally see New or Open here unless you have filtered for closed items.
Filtering and search
Search box
The Search vulnerabilities… box (top right) does a CONTAINS match on the vulnerability title and scopes results to active (new/open) findings. Press Enter to run it; clearing the box restores the full list.
Filter pills
The filter bar supports these fields, combined with AND/OR logic:
| Filter | Use it to |
|---|---|
| Title | Match on the vulnerability name. |
| Risk | Restrict to a severity band. |
| Status | Include or exclude new / open / closed. |
| Source | Filter by the scanner/source that raised the finding. |
| Country | Geographic location of the affected asset. |
| CVE ID | Pin to a specific CVE identifier. |
| Added On | First-seen date range. |
Keep closed items out of custom filters
Applying a filter overrides the built-in status IN (new, open) default. If you build a filter on, say, Risk or CVE ID and don't want resolved findings creeping back in, add a Status rule for new/open explicitly.
Severity chips
The All / High / Medium / Low chips below the distribution bar are one-click severity filters. They combine with whatever filter pills are active and re-assert the active-status scope. Clicking the active chip again (or All) clears the severity filter and restores your pill filters.
Detail view
Click a row to open the vulnerability detail page. The header shows the risk badge and title plus metadata chips: the risk score and label, an open · closed · total asset breakdown, and — when available — the CVSS score and CWE identifier pulled from the finding's classification data.
Below the header are three tabs:
Solution
A collapsible panel with Description, Impact, Recommendation, and References. This is the remediation guidance ShadowMap attaches to the finding. References render as external links. (Content is sanitized before display.)
Affected Assets
A table of the individual alerts behind this vulnerability:
| Column | What it shows |
|---|---|
| Host | The affected hostname. |
| IP | The asset's IP address. |
| Port | The port the finding was observed on. |
| Risk | Numeric risk score for that specific instance. |
| First Seen | When the alert was first raised (added_on). |
| Last Seen | Most recent observation (last_seen_on). |
Above the table, Open / Closed / All chips switch which slice you're viewing. The chips show live counts and the selection is reflected in the page URL (?status=…), so a deep link or browser back/forward preserves the scope. The view defaults to Open so the count matches the list page. Use Load more to page through large asset lists; clicking a row (or the eye icon) opens that individual alert in Alerts.
Open vs. closed counts
The open/closed/total breakdown in the header always reflects every alert ever tagged with this title, regardless of the chip selected — so you can see the full history at a glance. Only new/open count as Open and only closed counts as Closed; response statuses like Accepted Risk or Investigating are tracked separately in the Alerts module and are not folded into these chip totals.
Trend
A 6-month line chart of new occurrences per month for this vulnerability, scoped to the chip you've selected. Use it to confirm whether remediation is actually reducing exposure or whether a weakness keeps reappearing.
Taking action
| Action | Where | What it does |
|---|---|---|
| Open detail | Click any row | Drill into solution, affected assets, and trend. |
| View in Alerts (detail) | Detail header button | Opens Alerts pre-filtered to this title and the current status slice. |
| View in Alerts (bulk) | Select rows → bulk bar | Opens Alerts filtered to all selected titles (new/open). |
| Export | Header Export button | Queues an async Excel export — one row per vulnerability group — honoring your active filters. You're notified when it's ready. |
| Customize columns | view_column icon | Show/hide optional columns; saved in your browser. |
To select rows for the bulk action, use the row checkboxes (or the header checkbox to select the whole page). Remediation itself — changing status, accepting risk, assigning — happens on the underlying alerts in Alerts; this page is your prioritization and triage surface.
From overview to action
A typical workflow: sort by Risk, scan the Trending Up and High bands, open a detail page to read the Recommendation, then click View in Alerts to work the individual instances or trigger a response.
Common questions
Why does a vulnerability show 50 assets but I only see a few alerts in Alerts? The Assets count includes every alert in the title group, while your Alerts view may be filtered. Open the detail page's Affected Assets tab (set the chip to All) to see the full list backing the count.
A vulnerability I fixed still shows here. Why? By default the list shows only new/open findings. If it's still listed, at least one instance hasn't been re-scanned and closed yet. Open the detail page and check the Open count — if it's above zero, those instances are still considered active.
Where's the "Critical" severity? This view uses High as its top band (score ≥ 8); there's no separate Critical tier here. The same thresholds apply across the Alerts engine.
Why is the trend arrow red when the number went up? Risk semantics are inverted from finance: more occurrences of a vulnerability is worse, so an increase is shown in red and a decrease in green.
Can I export just the High-severity vulnerabilities? Yes. Apply the High chip (or a Risk filter), then click Export. The export honors the filters currently applied to the list.
Does this page change my alert statuses? No. Vulnerability Overview is read-only aggregation. Status changes, risk acceptance, and assignments are performed on the underlying records in Alerts.
What's the difference between this and the CVE Feeds page? Vulnerability Overview is your findings, grouped — weaknesses ShadowMap has actually observed on your assets. The CVE-focused intelligence views track the broader CVE landscape and disclosures. See the related links below.
Related
- Alerts — the underlying per-instance dataset this page aggregates; where you actually triage and change status.
- Open Ports — many service-level vulnerabilities surface alongside exposed ports.
- SSL Issues — certificate and TLS weaknesses that appear as vulnerabilities here.
- App Misconfigurations — application-layer findings that feed into this overview.
- CVE Feeds — CVE-centric tracking, complementary to your observed vulnerabilities.
- Severity Levels — how ShadowMap's risk bands and scores are defined.
- Status Workflow — what New, Open, and Closed mean and how findings move between them.