IP Reputation
IP Reputation surfaces the IP addresses in your attack surface that appear on public threat-intelligence blocklists and abuse feeds — and tells you whether the listing is a likely compromise of one of your own servers or just co-tenant noise on a shared CDN/cloud IP. Every row is one of your mapped-host IPs that a reputation feed flagged, scored by how confident the listing is and whether it points at an asset you exclusively control.
Overview
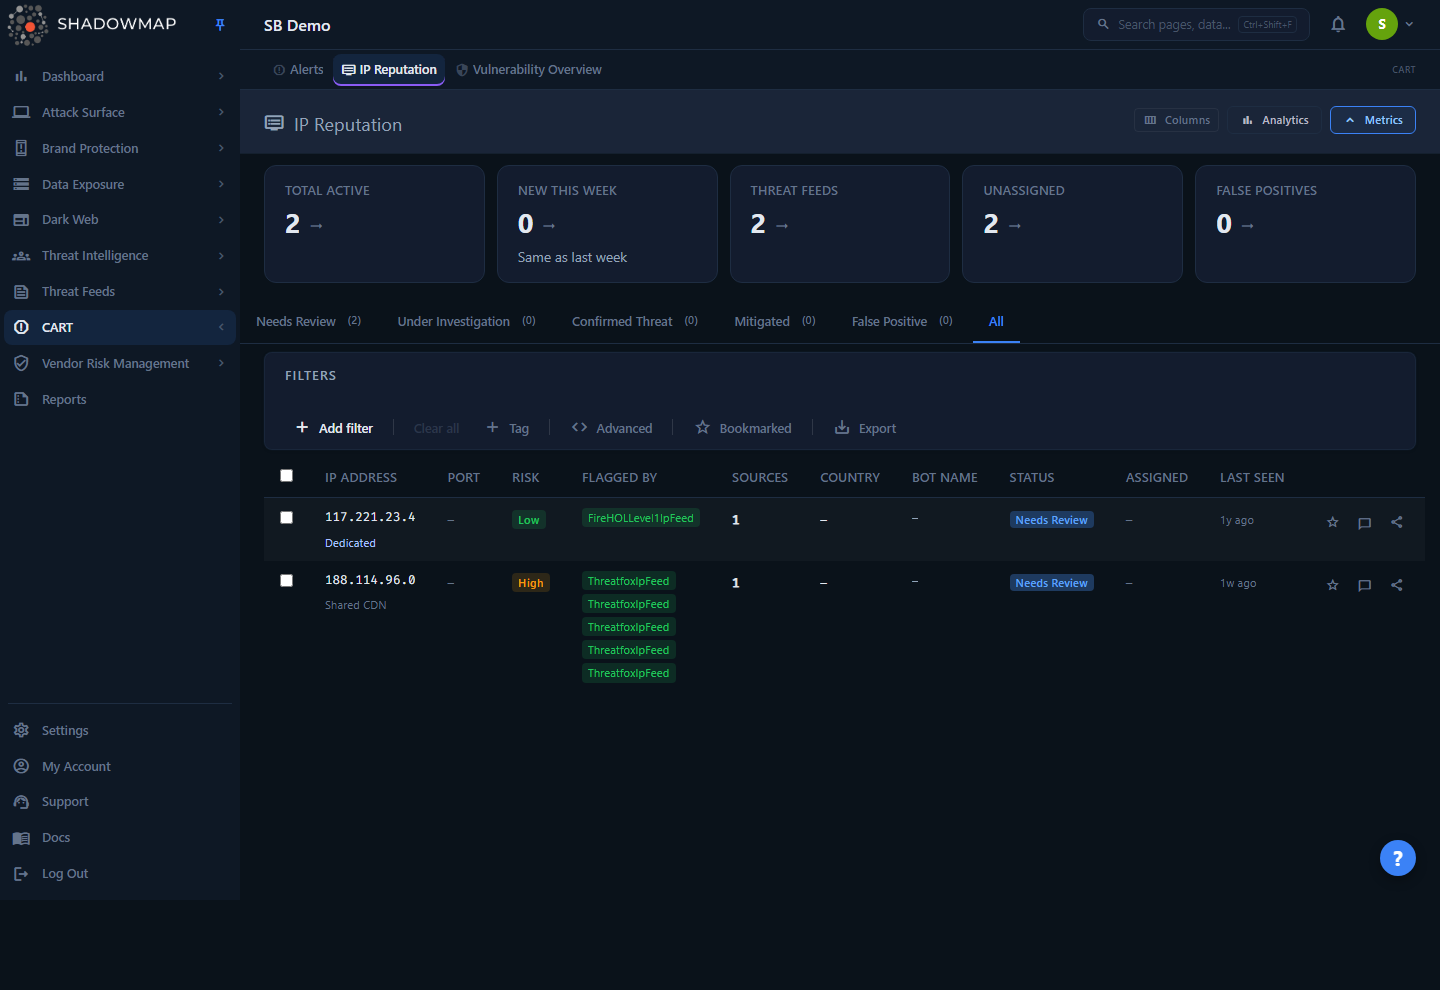
The page is a table-first triage workspace. At the top, a five-card metrics strip and a collapsible analytics panel summarise your reputation posture; below them, status tabs split findings into the triage queue (Needs Review → Under Investigation → Confirmed Threat → Mitigated, plus False Positive). The table lists each flagged IP with its risk level, the feeds that flagged it, country, port, status, and assignee. Selecting a row opens a detail drawer; opening the full detail page gives you an Overview, Threat Intelligence, Related Items, and Activity tab.
This is a CART (Continuous Attack-surface Reduction & Threat) module, alongside Alerts and Vulnerability Overview. It shares the same v2 list mechanics: column customizer, FQP filters, bookmarks, bulk actions, comments, sharing, and export.
Every IP here is yours
Unlike a generic blocklist lookup, this module only contains IPs that are already in your asset inventory (your mapped hosts). The question is never "is this a bad IP somewhere on the internet" — it is "one of my IPs is on a blocklist; is that a real problem or noise." See IP Addresses for the inventory these findings link back to.
How it works
The mechanics that drive risk and ordering are not visible in the UI — they are computed server-side from the feed data and the IP's ownership. Understanding them is the difference between chasing every listing and triaging the handful that matter.
How an IP lands here
The scanning backend checks each IP in your inventory against multiple public reputation feeds and abuse blocklists. When one or more feeds list an IP you own, a row is created (or updated) in this module. The feeds that flagged it are stored as a pipe-separated string in flagged_by, and the richer "why" — malware family, threat type, C2 status, MISP correlation, Tor-exit flag — is captured in a structured data blob when the feed provides it.
Risk level — confidence-weighted, not a count
Risk is not a count of how many feeds flagged the IP. It is computed from two signals: the highest-confidence feed tier that flagged it, and whether the IP is a dedicated (exclusively yours) host versus a shared CDN/cloud IP. Feeds are grouped into confidence tiers:
| Tier | Example feeds | Meaning |
|---|---|---|
| High | ThreatFox, Feodo Tracker | High-fidelity C2 / IOC trackers — a listing here is usually a real malicious host |
| Medium | Spamhaus, DShield, CINS, Blocklist.de, DigitalSide | Reputable abuse/attack blocklists |
| Low | IPsum, FireHOL, GreenSnow, Ellio | Noisy aggregators that re-publish many other lists |
The risk level is then derived:
| Risk | When it is assigned |
|---|---|
| Critical | The IP is an active malware/C2 host (or flagged by a high-tier feed) and it is a dedicated host you exclusively control — a possible compromise of your own server |
| High | Active malware/C2 or high-tier listing, but on a shared CDN/cloud IP — verify whether it is your asset or a co-tenant |
| Medium | A medium-tier feed flagged it, or four or more independent aggregator lists agree |
| Low | Aggregator-only listings (fewer than four), especially on shared infrastructure — almost always co-tenant noise |
Why ownership matters
A high-fidelity C2 listing on 198.51.100.10 that only you run is an incident. The exact same listing on a Cloudflare or AWS edge IP you share with thousands of other tenants is almost certainly someone else's problem that happened to taint a shared address. The module never hides either case, but it scores and sorts them very differently.
Ownership classification
Ownership is read from the IP's ASN/provider string. Provider names matching known CDNs (Cloudflare, Akamai, Fastly, CloudFront, Imperva, and others) are tagged Shared CDN; major cloud providers (AWS, GCP, Azure, DigitalOcean, Linode, OVH, Hetzner, Oracle, and others) are tagged Shared cloud; anything else is treated as Dedicated. Dedicated rows carry a "Dedicated" tag next to the IP in the list so you can spot them at a glance.
Relevance — a computed priority badge
The Relevance column is a computed ranking, not a stored value. It blends the confidence-weighted risk level (critical/high/medium/low) with asset criticality derived from ownership: a dedicated host ranks highest, a shared cloud IP lower, and a shared CDN IP lowest. The effect is that "this is your own server, and it is listed as malicious" ranks above "your CDN edge shares an address that a co-tenant got listed on" — even when both are technically visible. The list itself defaults to sorting by newest first (when the IP landed here); use the Relevance badge to judge which of the visible findings deserves attention first.
Source count vs. Threat Feeds
source_count (the Sources column) is the number of distinct feeds that flagged a single IP, parsed from flagged_by. The Threat Feeds metric card is a different number — COUNT(DISTINCT flagged_by) across all your active findings — so it reflects how many distinct feed combinations are flagging your estate, not a high-risk IP count. Treat the card as a breadth indicator, not a severity count.
Understanding the data
Columns
The IP Address column is always shown; the rest are toggleable via the column customizer.
| Column | Description |
|---|---|
| IP Address | The flagged IP, with a "Dedicated" / "Shared CDN" / "Shared cloud" ownership tag beneath it |
| Port | The port associated with the flagged activity, if the feed supplied one |
| Risk | Confidence-weighted risk level: Critical, High, Medium, or Low (see above) |
| Relevance | Computed priority badge blending risk and asset ownership (see above) |
| Flagged By | Badges for each distinct feed that listed the IP (up to five shown) |
| Sources | Count of distinct feeds flagging this IP |
| Country | Geographic country code of the IP |
| Bot Name | The malware/botnet family from the feed metadata or MISP correlation, when present |
| Status | Triage status (see below) |
| Assigned | Initials of the analyst the finding is assigned to |
| Last Seen | Relative time the IP was last observed on a feed |
Status workflow
IP Reputation uses a five-state triage lifecycle. Each status is a tab, and each tab shows a live count.
| Status | Meaning |
|---|---|
| Needs Review | New / unhandled finding awaiting triage (the default queue and landing tab) |
| Under Investigation | An analyst is actively assessing whether the listing is legitimate |
| Confirmed Threat | Verified as a real reputation/compromise issue requiring remediation |
| Mitigated | The underlying issue has been remediated (patched, reconfigured, delisted, or decommissioned) |
| False Positive | Not a genuine concern — typically shared-hosting co-tenant noise or a stale historical listing |
| All | Every finding regardless of status |
"Needs Review" = active
Internally, "Needs Review" is the active state — the two names are interchangeable. The metrics strip and analytics reflect active findings unless you switch tabs.
Filtering & search
The filter bar supports FQP (field/operator/value) rules combined with AND/OR logic. Each status tab pre-loads the matching response_status filter, which you can extend or modify. Available filter fields:
| Field | Notes |
|---|---|
| IP Address | Match a specific IP |
| Port | Filter by port number |
| Flagged By | Filter by reputation feed |
| Country | Filter by country code |
| Risk Level | Filter by Critical / High / Medium / Low |
| Status | Triage status |
| Assigned To | Filter by assignee (supports "is not set" for unassigned) |
| Bot Name | Malware/botnet family |
| Relevance Score | Filter by computed relevance |
| Source Count | Number of flagging feeds |
| Bookmarked | Restrict to bookmarked findings |
| Last Seen | Date filter |
| First Seen | Date filter (the created_at of the finding) |
Additional controls live in the filter bar: a free-text search box, a Bookmarked toggle (star), custom-tag filters, and Export. Search and FQP rules are mutually exclusive — when FQP rules are active, the free-text query is suppressed so the two do not conflict.
Quick filters from the metrics strip
Four of the five metric cards are clickable and apply a matching filter: Total Active (all active), New This Week (active findings created in the last 7 days), Unassigned (active with no assignee), and False Positives. The Threat Feeds card is informational and not clickable.
Metrics strip
| Card | What it counts |
|---|---|
| Total Active | All findings in the active (Needs Review) state |
| New This Week | Active findings created in the last 7 days, with a week-over-week trend arrow (red = more, green = fewer) |
| Threat Feeds | Distinct feed combinations flagging your IPs (breadth, not a risk count) |
| Unassigned | Active findings with no analyst assigned |
| False Positives | Findings marked false positive |
Analytics panel
A collapsible panel renders four charts from the analytics endpoint: a 30-day trend line, a Source Distribution bar (which feeds are flagging the most IPs), a Country Distribution bar, and a Risk Level Distribution donut. Use these to spot whether a spike is driven by one noisy feed, a geo-concentration, or a genuine rise in high-risk listings.
Detail view
There are two ways to inspect a finding: the quick drawer (click a row) and the full detail page.
The drawer
The side drawer has two tabs — Overview and Comments. The Overview leads with a verdict banner: the IP, its risk badge, an ownership badge, and a plain-language risk reason — for example, "Dedicated host flagged as active {malware} — possible compromise" or "Listed by 2 aggregated blocklists on a shared CDN IP — likely a co-tenant listing" — so you understand the verdict without decoding the badge. Below the verdict it shows a Your asset section (linked hosts, reverse DNS, location, open ports, related alerts), a Why it's flagged section (the flagging feeds plus feed-native threat context and any MISP correlation), an ownership-aware Recommended action, and operational metadata (status, assignee, last seen, days open).
The full detail page
The standalone detail page has four tabs:
- Overview — IP, port, protocol, country, bot name, source count, risk level, assignee, status, first/last seen, the list of Flagged By Sources, derived Threat Categories (e.g. Active C2, Tor Exit Node, MISP IOC), and a Raw Intelligence Data block with the structured feed JSON.
- Threat Intelligence — a threat-score breakdown (risk level, source count, total reports) and a per-source report table.
- Related Items — cross-references to related Alerts and Open Ports for the same IP, so you can assess exposure and impact in context.
- Activity — the comment thread for the finding.
Stale-data guard
On the full detail page, if a refresh fails for any reason other than the record being genuinely gone, the page keeps showing the last-known record behind a "Data may be stale" banner and disables mutations (bookmark, share, comments) until you successfully retry. A true 404/401/403 shows a "Not Found" state instead. This prevents you from acting on a record whose server-side state may have changed.
Taking action
Select one or more findings to reveal the bulk action bar, or act on a single finding from its row / drawer:
- Change status — move findings through the triage lifecycle: Needs Review, Investigate (Under Investigation), Confirmed (Confirmed Threat), Mitigated, or False Positive.
- Bookmark — star findings to build a working set; the Bookmarked toggle filters to just those.
- Comment — add internal notes for team coordination, using comment templates where configured.
- Share — share selected findings via the configured sharing/integration channels.
- Export — download the current filtered, sorted view for reporting.
Bulk status applies per-item
The module has no batch status endpoint — a bulk status change iterates over the selected findings one at a time. Large selections take proportionally longer, and the list/metrics refresh once the run completes.
A recommended triage flow for a flagged IP: confirm the ownership tag (dedicated vs. shared), check which service/port is exposed, cross-reference Related Items and your IP Addresses inventory to gauge the asset's importance, remediate the underlying cause, request delisting from the relevant blocklist, then mark Mitigated. For shared-hosting or historical listings outside your control, mark False Positive.
Common questions
Why is one of my IPs here at all — I did not put it on any blocklist? A reputation feed listed it. Common causes: a compromised server sending spam or joining a DDoS; an open relay/proxy being abused; a shared-hosting neighbour's activity tainting the IP; leftover reputation from a previous owner of the address; or a misconfigured service generating traffic that looks malicious. The module's job is to tell you which of these is likely, via the risk level and ownership tag.
Critical vs. High — what actually changed? Ownership. Both mean a high-confidence malicious/C2 listing. Critical is on a dedicated host you exclusively control (treat as a possible compromise); High is the same listing on a shared CDN/cloud IP, where it may be a co-tenant rather than your asset.
A low-risk finding has four feeds flagging it but stays Low — why? Risk is driven by feed confidence, not volume — but as a safeguard, four or more independent aggregator lists agreeing bumps an otherwise-low finding to Medium. If all four are noisy aggregators on a shared IP, it remains low-priority by design.
The "Threat Feeds" card number does not match my high-risk count. It is not a risk count. It is the number of distinct flagged_by feed combinations across your active findings — a breadth metric. Use the Risk Level Distribution donut or the Risk filter for severity counts.
What does "Dedicated" next to an IP mean? The IP's provider/ASN does not match a known CDN or major cloud provider, so it is treated as infrastructure you exclusively control. These rank highest in relevance because a listing there is most likely about your asset specifically.
Does marking False Positive delete the finding? No. It moves the finding to the False Positive tab and removes it from your active queue. You can still find it under that tab and reopen it by changing the status.
Related
- IP Addresses — the asset inventory these reputation findings link back to; start here to understand which service an IP belongs to.
- Open Ports — surfaced as Related Items in the detail view; check what is exposed on a flagged IP.
- Alerts — sibling CART module; reputation events for an IP may also raise alerts, cross-linked in Related Items.
- Vulnerability Overview — the third CART module, for vulnerability triage on the same estate.
- Indicators (IOCs) — for broader IOC context beyond your own estate, including IPs flagged in threat intelligence that may not be in your inventory.