Threat Intel Overview
The Threat Intelligence Overview is the landing page for the Threat Intelligence module. Unlike a generic threat feed, it does not show you "the internet's threats" — it correlates global intelligence (CVEs, CISA KEV, MISP threat-actor and IOC feeds) against the technology stack and assets ShadowMap has already discovered for your organization, then rolls the result into a single 0–100 Threat Exposure Score with a daily trend line.
Overview
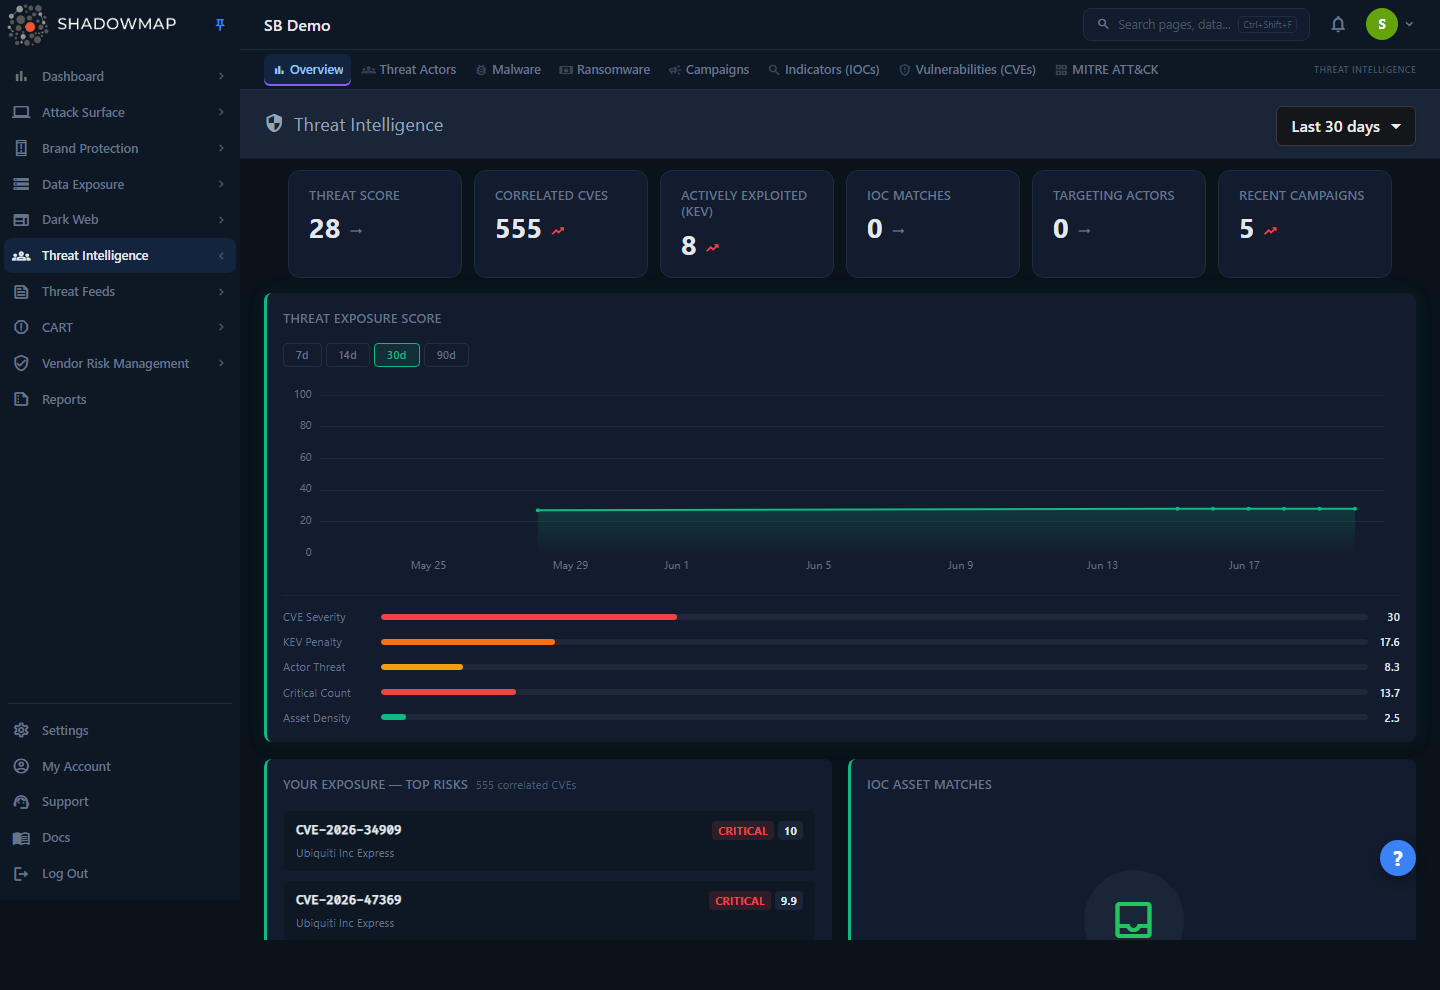
The page is a read-mostly dashboard. From top to bottom you get:
- A date-range selector (top right) — Last 7 days / Last 30 days / Last 90 days / All time. This controls the time window of the score trend chart only (see How it works).
- A six-card metrics strip — Threat Score, Correlated CVEs, Actively Exploited (KEV), IOC Matches, Targeting Actors, Recent Campaigns.
- The Threat Exposure Score chart — a full-width trend line with a 7d/14d/30d/90d toggle, a component breakdown, and a sector-median comparison.
- Your Exposure — Top Risks — the top CVEs matched to your tech stack, ranked by severity, each with a CVSS score, KEV flag, affected product, and how many of your assets run it.
- IOC Asset Matches — a table of your IPs, domains, or subdomains that appear in MISP indicator-of-compromise feeds, with a per-row dismiss action.
- Actors Targeting
<your sector>— threat actors whose declared target sectors include yours, ranked by associated campaign activity (only shown if your company has a sector configured). - Trending (30 Days) — a tabbed list of the most campaign-active threat actors and malware families across the global feed in the last 30 days.
- Recent Campaigns — the three most recent MISP campaigns, with a View All link to the Campaigns page.
In the left sidebar, the Threat Intelligence navigation group (Overview, Threat Actors, Malware, Ransomware, Campaigns, Indicators (IOCs), Vulnerabilities (CVEs), MITRE ATT&CK) links to the other Threat Intelligence sub-modules. The Overview itself is mostly a clickthrough surface: nearly every row and card deep-links into the relevant detail page.
Read it as "what should I worry about, in priority order?"
The Overview deliberately leads with your exposure — correlated CVEs and IOC matches — rather than vanity counts like "how many threat actors exist in the database." If you only look at one Threat Intelligence screen, this is the one.
How it works
Most of the value on this page comes from mechanics you cannot see in the UI: how ShadowMap correlates global intel to your assets, how the score is computed, and how often the numbers refresh.
Where the data comes from
The Overview joins three normally-separate data stores:
| Data | Source |
|---|---|
| Your tech stack and assets | Your tenant's asset inventory — application_technology (frameworks/CMS/libraries detected on web apps) and summarized_open_ports (products/services on open ports) |
| CVE catalog | ShadowMap's shared CVE database (NVD-derived: affected vendors/products, version ranges, CVSS metrics, KEV and ransomware flags) |
| Threat actors, malware, campaigns, IOCs | MISP threat-intelligence events shared across all tenants |
Correlation is per-tenant: the global CVE and MISP data is shared, but it is always filtered down to your discovered products and your assets before anything is displayed.
How CVEs are matched to your stack (and why the count is conservative)
The "Correlated CVEs" count and the Top Risks list are produced by a multi-stage match, not a naive product-name lookup:
- Collect your tech stack. ShadowMap gathers every detected product/version from your web-application technology fingerprints and your open-port service banners.
- Normalize product names. Detected names rarely match NVD naming exactly — e.g. an open-port scan reports
Apache httpdwhile NVD files the CVE under producthttp_server. A product-name mapping table expands your detected names to their NVD equivalents so the match isn't missed. - Match on product name against the CVE affected-products catalog.
- Filter by version. This is the key step. A product-name-only match returns every CVE ever filed for that product. ShadowMap then checks your detected version against each CVE's affected version ranges and drops CVEs that don't apply to your installed version. Each surviving CVE is tagged with a match confidence:
- high — your detected version was confirmed inside an affected range.
- medium — the CVE has no usable version range (product-name match only), or the version comparison was indeterminate.
- low — no version was detected for that product, so it can't be version-filtered; the match is kept conservatively.
Version-unknown matches are kept, not dropped
If a product is detected but its version isn't, the CVE stays in the list at low confidence rather than being silently removed. This errs toward showing you a potential exposure instead of hiding it — so a "Correlated CVEs" count can include some matches that a precise version check might later clear.
Threat actors are then layered on top: for each matched CVE, ShadowMap looks up MISP events that reference both that CVE and a threat actor, so a Top Risk can show "exploited by N actors."
How the Threat Exposure Score is calculated
The Threat Score (the first metric card, and the number plotted on the trend chart) is a composite 0–100 score where higher is better — 100 means no measured exposure, 0 means maximum exposure. (This direction matches the Security Rating, so the two read consistently.)
Internally the engine computes five penalty components from your correlated exposure, sums them, and subtracts the total from 100. Each component is capped and uses a logarithmic curve, so the first few findings move the needle hard and additional findings have diminishing impact:
| Component | Max penalty | What drives it |
|---|---|---|
| CVE Severity | 30 | Number of correlated CVEs, weighted by their average CVSS score (a log curve on count × an average-CVSS multiplier) |
| KEV Penalty | 25 | Count of your correlated CVEs that are in CISA's Known Exploited Vulnerabilities catalog — the highest-urgency signal |
| Actor Threat | 20 | Number of distinct threat actors linked to your correlated CVEs |
| Critical Count | 15 | Count of correlated CVEs at CRITICAL severity (CVSS 9.0+) |
| Asset Density | 10 | Average number of your assets affected per vulnerable product (wider blast radius = higher penalty) |
Threat Score = 100 − (CVE Severity + KEV Penalty + Actor Threat + Critical Count + Asset Density), clamped to 0–100. The five values shown as horizontal bars under the trend chart are exactly these penalty components — in the screenshot they sum to ~72, which is why the Threat Score reads 28.
Each daily snapshot also carries a letter grade (used in briefings and benchmarks):
| Grade | Score |
|---|---|
| A | 85–100 |
| B | 70–84 |
| C | 55–69 |
| D | 40–54 |
| F | below 40 |
Grade thresholds are deliberately lenient
Because almost every organization has some correlated CVEs and actors, standard 90/80/70 cutoffs would pile 80%+ of companies into an F. These thresholds are tuned to spread real-world companies across the full A–F range.
Sector comparison
If your company has a sector configured, ShadowMap compares your latest score against the median of the latest scores of all customers and POC customers in the same sector (anonymized — you never see another company's name or score). The line under the chart reads "Your score vs <sector> median." A sector needs at least 3 companies with stored scores before a median is computed; below that, the comparison line is simply not shown.
IOC asset matching
The IOC Asset Matches table answers "are any of our assets sitting in a threat feed?" A daily background job (scheduled at 03:00 UTC) takes a bounded sample of your inventory — up to 50 IPs, 30 domains, and 20 subdomains — and searches them against MISP IOC feeds (IPs against ip-dst/ip-src, domains against domain, subdomains against hostname). Calls are rate-limited (capped at 100 MISP calls per company, with a short delay between requests) to avoid overloading the feed. Any hit is stored as an active match. Dismissing a match (the × button) sets its status to dismissed so it drops off the list — use it for confirmed false positives or matches you've already investigated.
Refresh cadence
| Surface | When it updates |
|---|---|
| Threat Exposure Score snapshot (the trend points and grade) | Once per day, via a scheduled job at 02:00 UTC, for all active customers and POC customers |
| Correlated CVEs / exposure analysis | Computed on demand and cached ~1 hour; tech-stack collection is cached ~30 minutes; sector comparison ~6 hours |
| IOC asset matches | Refreshed by a daily background job at 03:00 UTC that re-checks the sampled inventory against MISP IOC feeds |
| Trending actors/malware, recent campaigns, sector actors | Read live from the underlying MISP data on each page load; trending and threat-profile widgets use a rolling 30-day window |
So the trend chart is daily — a brand-new tenant won't have a line until the first nightly snapshot runs, and same-day catch-up snapshots can cluster several points in one day (the chart handles this and will still label the axis correctly for the range you select).
Understanding the data
Metrics strip
| Card | Meaning |
|---|---|
| Threat Score | The current composite 0–100 exposure score (higher = better). An "up-bad" trend indicator appears when the score is above 50. |
| Correlated CVEs | Count of unique CVEs matched to your detected tech stack (after version filtering). |
| Actively Exploited (KEV) | Of those, how many are in CISA's Known Exploited Vulnerabilities catalog. Treat these as patch-now. |
| IOC Matches | Number of currently active (non-dismissed) IOC asset matches. |
| Targeting Actors | Number of threat actors whose declared target sectors include yours. |
| Recent Campaigns | Count of recent MISP campaigns surfaced on the page. |
Top Risks columns
Each row in Your Exposure — Top Risks (top 5 shown, ranked by CVSS) carries:
| Field | Meaning |
|---|---|
| CVE name | e.g. CVE-2026-34909; click to open the CVE detail page |
| Severity badge | CRITICAL / HIGH / MEDIUM / LOW, color-coded |
| CVSS score | The base CVSS score for the CVE |
| KEV badge | Present only if the CVE is in CISA KEV |
| Vendor / product | The affected product detected in your stack |
| Asset count | How many of your assets run that product |
| Actor count | How many threat actors are linked to the CVE (when known) |
IOC Asset Matches columns
| Column | Meaning |
|---|---|
| Asset | Your IP, domain, or subdomain that matched |
| Type | The asset type (ip / domain / subdomain) |
| IOC Value | The indicator value from the feed |
| Event | The MISP event description/comment |
| (action) | × dismisses the match |
Actors Targeting your sector
A three-column table (Actor, Country, Motivation), top 5 shown, ordered by associated campaign count. Click a row to open the actor's detail page. This card only appears when your company has a sector set.
Trending (30 Days)
A two-tab list — Actors and Malware — showing up to 8 entries each, ranked by the number of distinct MISP campaigns each was associated with in the last 30 days. This is global threat-landscape activity (not scoped to your assets). Click an entry to open its detail page.
Filtering & search
This page has one control: the date-range dropdown in the header (Last 7 days / 30 days / 90 days / All time). It rescopes the Threat Exposure Score trend chart to that window and is remembered between visits. Note the score-history backend caps the window at 90 days, so "All time" shows at most the last 90 days of snapshots.
The date range only affects the trend chart
The metrics strip, Top Risks, IOC matches, sector comparison, and trending widgets are not date-scoped by the header dropdown — they always reflect your current exposure and the standard rolling windows described above. The 7d/14d/30d/90d buttons directly on the chart and the header dropdown both control the trend window; they don't filter the rest of the page.
Taking action
The Overview is a triage launchpad. From here you typically:
- Patch the KEV first. Check the "Actively Exploited (KEV)" card — anything counted there is a CVE under active exploitation that also affects your stack. Open the Top Risks list and prioritize KEV-flagged rows.
- Work the Top Risks. Click a CVE to open its detail page, where you can see exactly which of your assets are affected and the version evidence behind the match.
- Investigate IOC matches. Each active match is one of your assets appearing in a threat feed. Investigate, then dismiss (×) confirmed false positives so the list stays signal-rich.
- Watch your trend. A rising Threat Score line (improving posture) or a falling one (degrading) over 30/90 days is the headline for executive reporting. The five breakdown bars tell you which component is dragging the score.
- Pivot to actors and campaigns. Use the "Actors Targeting your sector" and "Recent Campaigns" cards to understand who is active against organizations like yours.
There are no bulk actions or exports on this page itself — dismissing an IOC match is the only state-changing action. For deeper work, follow the deep-links into Vulnerabilities (CVEs), Threat Actors, Indicators (IOCs), and Campaigns.
Common questions
Why is my Threat Score "only" 28 — is that bad? Higher is better, so 28 indicates significant exposure. The five bars under the chart explain it: a high CVE Severity bar means many/severe correlated CVEs, a high KEV bar means actively-exploited vulnerabilities, and so on. The score is 100 − sum of those penalties.
The Correlated CVEs count looks higher than the CVEs I think actually apply to me. Why? ShadowMap keeps matches conservatively. CVEs where no version could be detected (low confidence) or where the CVE has no usable version range (medium confidence) are kept rather than dropped, so the count can include matches a precise version check would later clear. Open the CVE detail to see the per-asset evidence and match confidence.
My trend chart is empty or shows only one point. The exposure score is snapshotted once per day at 02:00 UTC. A new tenant has no history until the first nightly run; the line fills in over subsequent days. Several same-day points can appear when catch-up snapshots run close together.
Why don't I see the "Actors Targeting your sector" or sector-comparison line? Both require your company to have a sector configured. The sector median additionally needs at least 3 companies in your sector with stored scores before it will display a value.
Does the date range at the top filter the whole page? No — it only rescopes the Threat Exposure Score trend chart. The metrics, Top Risks, IOC matches, and trending widgets reflect current exposure and fixed rolling windows.
My IOC Matches card is empty. Is that good? Yes — an empty IOC Matches card means none of the sampled IPs, domains, or subdomains from your inventory currently appear in the MISP IOC feeds. Note the check samples a bounded subset of large inventories, so absence here is "no match in what was checked," not a guarantee across every asset.
Is the sector comparison exposing other companies' data? No. Only an anonymized median (and percentile rank, internally) is computed across same-sector tenants. No other company's name or individual score is ever shown.
Related
- Vulnerabilities (CVEs) — the full, filterable list behind the Top Risks card, with per-CVE asset evidence and version matching.
- KEV Compliance — drill into the Actively Exploited (KEV) count as a tracked remediation workflow.
- Indicators (IOCs) — search and bulk-check indicators; the source of the IOC Asset Matches widget.
- Threat Actors and Campaigns — detail behind the "Actors Targeting your sector," Trending, and Recent Campaigns cards.
- Threat Intelligence — the module landing index and all sibling sub-pages.
- Security Rating — a separate organization-wide posture score that uses the same "higher is better" convention as the Threat Exposure Score.
- Vulnerability Overview — the operational vulnerability view in the Threats module, complementary to the intel-driven correlation here.