
Executive Posture
Executive Posture is a single-scroll, board-ready narrative of where your organization stands. It takes the same Security Rating that drives the rest of ShadowMap and composes it into one leadership brief — the grade and its trajectory, the categories driving it, what moved this period, how fast your team is remediating, the exposures that would actually hurt, a prioritized plan with a projected grade, and how you compare to sector peers — with a one-click PDF export for the boardroom.
Overview
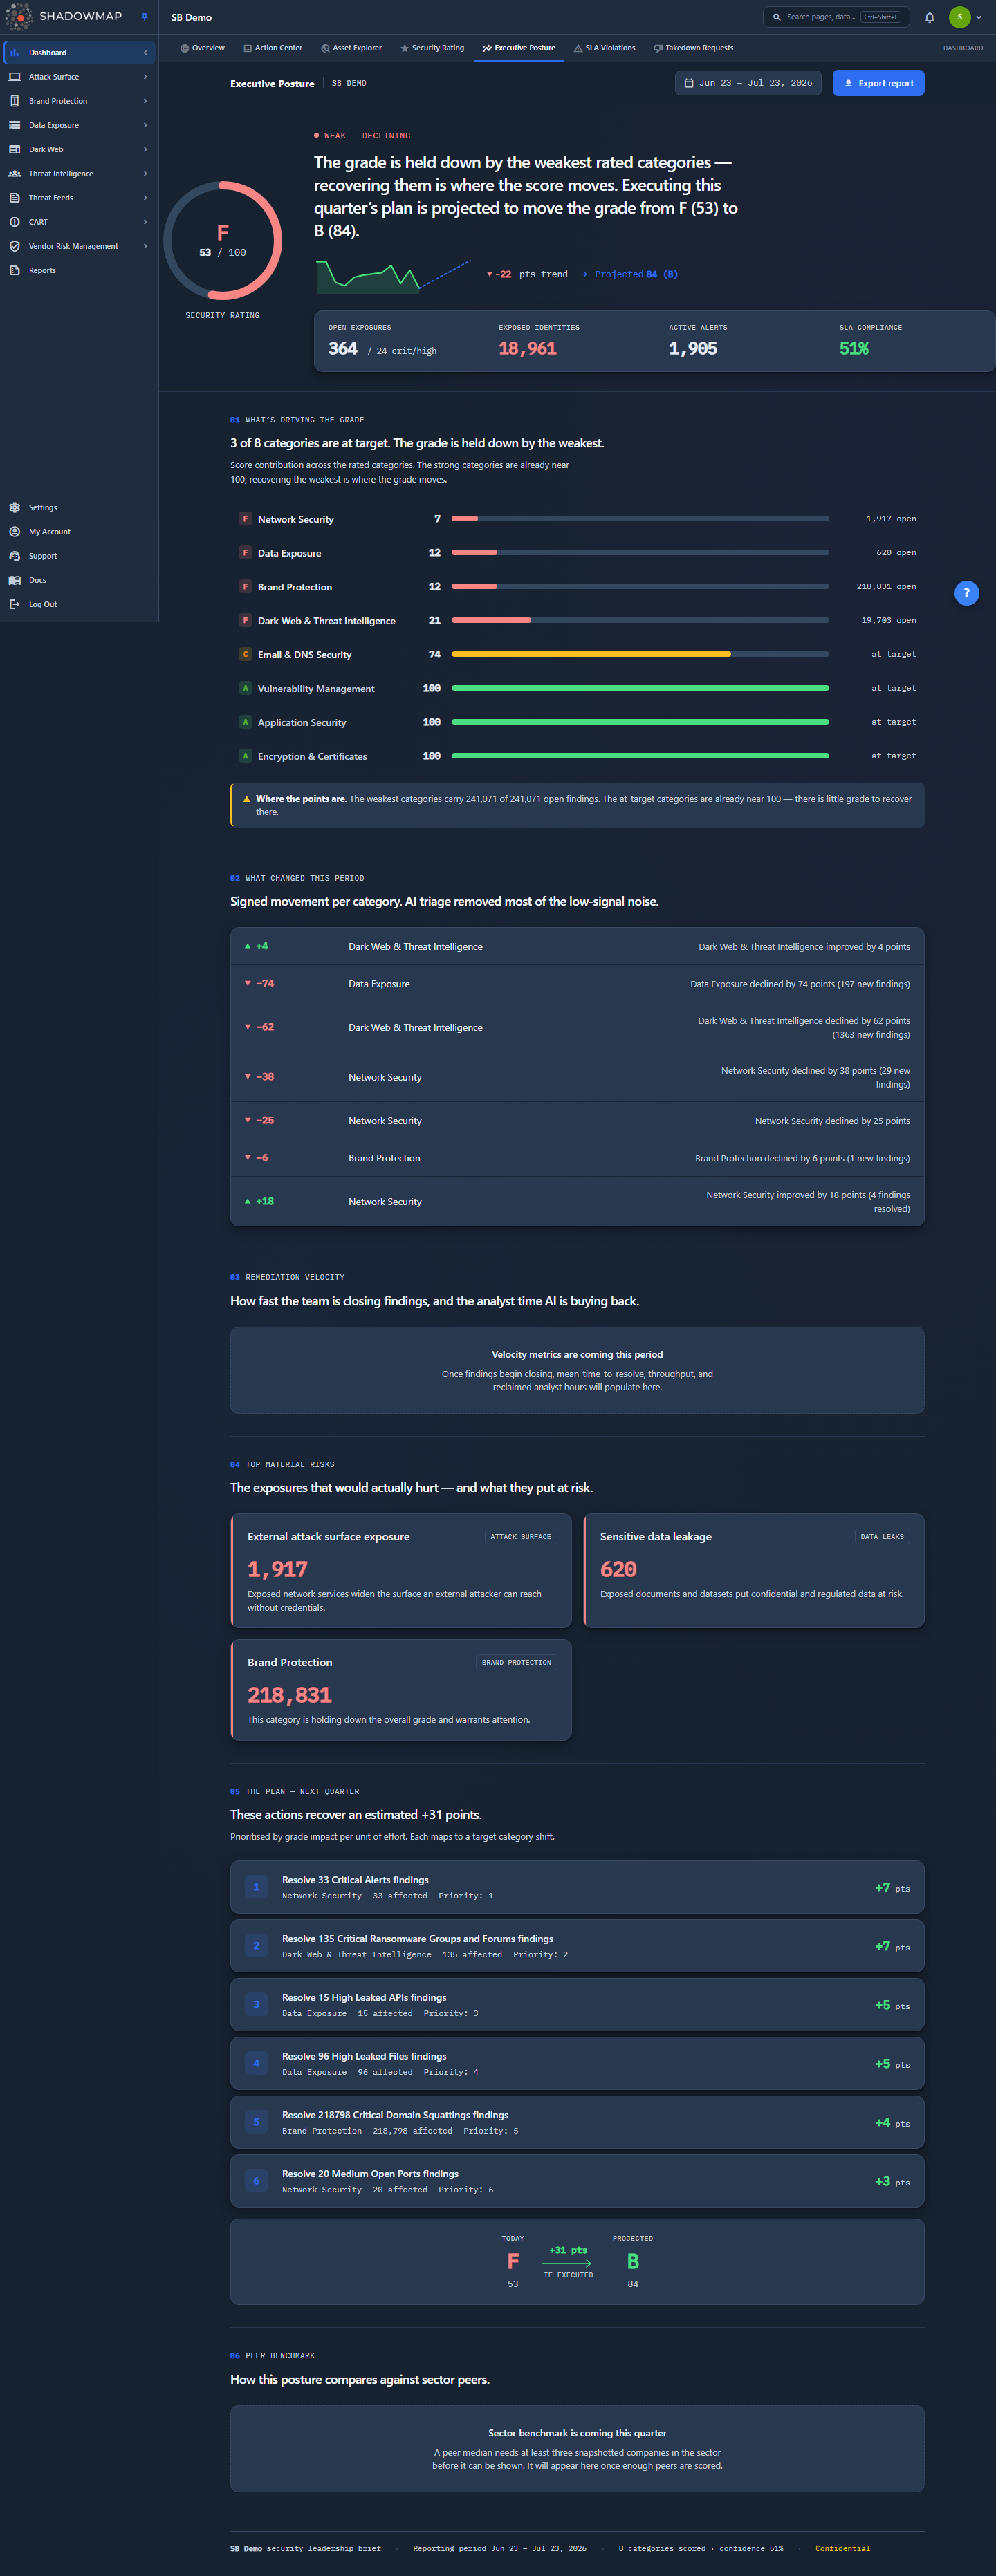
Open it from Dashboard → Executive Posture (/dashboard/executive-posture). The page is one continuous narrative, top to bottom:
| # | Section | What it answers |
|---|---|---|
| — | Hero | What is our grade, which way is it trending, and where would the plan take us? |
| 01 | What's driving the grade | Which rated categories hold the score down, and where the open findings sit. |
| 02 | What changed this period | Signed, per-category score movement over the last 30 days, with the cause. |
| 03 | Remediation velocity | How fast findings are closing, and the analyst time AI review is buying back. |
| 04 | Top material risks | The weakest categories, restated as business-impact risk cards. |
| 05 | The plan — next quarter | The highest-impact open actions and the grade they project to. |
| 06 | Peer benchmark | Where your rating sits against other companies in your sector. |
A sticky top bar carries your organization name, the reporting period, and an Export report button. A footer restates the brief's provenance: organization, reporting period, categories scored, model confidence, and a Confidential marker.
This is a view, not a new scan
Executive Posture does not scan anything or compute its own scores. It binds numbers that already exist — your Security Rating, your recommendations, your findings — and reframes them for a leadership audience. Fixing a finding in its own module is still what moves everything here. See Security Rating for how the underlying score is built.
How it works
The mechanics below are not visible on the page but determine exactly what each section means.
One request, one composed payload
When the page loads it makes a single call to GET /dashboard/executive-posture/get. The server assembles the entire brief in one place — grade, drivers, changes, velocity, risks, plan, benchmark, and metadata — and the page is a thin shell that renders it. The same composer feeds the PDF export, so the live cockpit and the exported report always bind byte-identical data.
Reporting period is the last 30 days
Every "this period" number — the What Changed deltas, remediation velocity, and the AI-review rollup — is measured over a rolling 30-day window ending today. The period is shown in the top bar and footer (for example, Jun 23 – Jul 23, 2026).
Grade bands
The letter grade is a fixed banding of the 0–100 score, identical to the Security Rating bands, and applied to the overall score, each category, and the projected score:
| Grade | Score range |
|---|---|
| A | 90 – 100 |
| B | 80 – 89 |
| C | 70 – 79 |
| D | 60 – 69 |
| F | 0 – 59 |
Colour tone follows the band throughout: green at 80+, amber at 60–79, red below 60.
Sections degrade independently
Remediation velocity, the AI-review rollup, the peer benchmark, and each hero KPI are pulled from separate sources, and each is failure-isolated. If the data behind one block is unavailable — a lean tenant that doesn't run a given module, or not enough peers for a benchmark — that block shows its own empty state (for example, "Velocity metrics are coming this period" or "Sector benchmark is coming this quarter") rather than breaking the page. In the screenshot above, velocity and the benchmark are both in their empty state on this tenant while every other section is populated.
How AI is used here — precisely
Executive Posture does not run a language model and does not write prose with AI. The section headlines and the one-sentence hero thesis are templated from your own numbers — they change with your data, but no text is model-generated.
The only AI in this view is a read-only rollup of AI-review activity that other modules already performed. Over the reporting period it counts how many findings ShadowMap's per-module AI Review examined, how many it auto-dismissed as low-signal ("filtered"), and how many it escalated to an analyst, then converts the auto-dismissed count into reclaimed analyst-hours (roughly eight minutes of manual triage saved per auto-dismissed finding). Those numbers surface in exactly two places:
- the AI triage line under What changed this period, and
- the Analyst time reclaimed tile under Remediation velocity.
If no module has AI Review enabled — or nothing was reviewed this period — the AI triage line simply doesn't appear, and the Analyst time reclaimed tile reads ~0 hrs (or, when there are also no closures, the whole velocity section falls to its empty state). Nothing here implies AI reviewed a finding that a module's own AI Review did not.
Who can see it
Executive Posture is gated on the dashboard.security-rating:read permission — the same permission as the Security Rating page, because it composes the same feed. Anyone who can see your Security Rating can see this brief; anyone who can't, can't. Both the navigation entry and the data endpoints enforce it. See Roles & Permissions.
The hero: grade, trajectory, projection
The hero is the one-glance summary.
- Grade ring — your overall Security Rating as a letter grade and
score / 100, coloured by band. - Status kicker — a two-word read of standing and direction, for example WEAK — DECLINING or STRONG — IMPROVING. Standing comes from the grade band (Strong for A/B, Fair for C/D, Weak for F); direction comes from the actual month-over-month trend. It will never say "improving" on a declining score — this is a leadership view and is built not to mislead.
- Trajectory sparkline — your monthly overall-score history as a line, with a dashed tail projecting to the post-plan grade. The
▲/▼ N pts trendchip is the change from the first to the most recent month in the series. - Projected chip —
→ Projected {score} ({grade}), the grade you'd reach by executing the plan in section 05. - Hero KPIs — four leadership metrics, described next.
Hero KPIs
Four numbers sit beneath the thesis. Each is drawn from live module data and is failure-isolated — a KPI whose backing data is absent on your tenant reads 0 (SLA compliance falls back to 100%) rather than erroring.
| KPI | What it counts |
|---|---|
| Open exposures | Total open exposure findings across severities, with the critical/high subtotal shown alongside (… / N crit/high). |
| Exposed identities | Leaked credential records tied to your organization, drawn from the stealer-log credential store behind Stealer Logs. |
| Active alerts | Total open alerts across severities. |
| SLA compliance | The share of your SLA violations that are closed, as a percentage. When there are no violations, this reads 100%. |
01 · What's driving the grade
Every rated category as a horizontal bar, sorted weakest first — because that's where the grade actually moves. Each row shows the category's letter grade, its 0–100 score, a coloured fill, and its open-finding count (or at target when nothing is open).
The section heading tallies how many of your categories are at target (green, 80+) versus held down by the weakest. A note beneath calls out concentration — for example, "the weakest categories carry 241,071 of 241,071 open findings" — the point being that the at-target categories are already near 100, so there is little grade left to recover there. Put effort into the red rows.
These are the same eight categories as the Security Rating
The drivers are your Security Rating categories — Vulnerability Management, Network Security, Application Security, Encryption & Certificates, Email & DNS Security, Dark Web & Threat Intelligence, Data Exposure, and Brand Protection — reordered worst-first. To see the factor chips and per-finding breakdown behind a category, open the Security Rating scorecard.
02 · What changed this period
Signed score movement per category over the last 30 days, each row carrying a direction and a plain-language cause:
| Marker | Direction | Meaning |
|---|---|---|
| ▲ +N | Up | The category's score rose by N points this period. |
| ▼ −N | Down | The category's score fell by N points this period. |
| ● 0 | Flat | No net movement. |
| ✦ AI | AI triage | A summary line (not a category) of AI-review activity this period. |
The causes are the same authoritative change explanations shown on the Security Rating history — for example, "Data Exposure declined by 74 points (197 new findings)" or "Network Security improved by 18 points (4 findings resolved)." When at least one finding was auto-filtered or escalated by a module's AI Review this period, a trailing AI triage line summarizes it ("N findings auto-filtered, M escalated to analysts") with an AI review badge. If no score moved and there was no AI activity, the section shows "No score movement recorded for this period yet."
03 · Remediation velocity
How fast findings are closing, shown as four tiles:
| Tile | What it measures |
|---|---|
| Mean time to resolve | Average days from a finding's discovery to its closure, with a trend versus the previous 30-day window (▼ from N d is faster/better, ▲ from N d is slower). |
| SLA compliance | The share of your SLA violations that are closed. |
| Resolved this period | Count of findings closed in the window, with a weekly throughput bar sparkline (the latest week highlighted). |
| Analyst time reclaimed | Estimated analyst-hours saved by AI auto-triage this period (see how AI is used). |
Velocity measures the workflow modules that record closures
Mean-time-to-resolve and throughput are computed from the modules that record a closure event with a timestamp — Social Media monitoring, Internal Hosts, and the CVE and KEV remediation trackers. It is a cross-module velocity signal, not a count of every closure across every module. Until findings begin closing in those stores, the section shows "Velocity metrics are coming this period" — which is what you see on the demo tenant in the screenshot above.
04 · Top material risks
Your weakest categories, restated in the language leadership cares about. Each card gives a business-impact title, the owning module, the driving open-finding count, and a one-line "so what."
Known categories map to a fixed framing; a category with no mapping falls back to its raw name with a generic note, which is why a card may occasionally show a plain category label instead of a business title:
| Weakest category | Risk card title | Points to |
|---|---|---|
| Network Security | External attack surface exposure | Attack Surface |
| Application Security | Application compromise | Web Applications |
| Data Exposure | Sensitive data leakage | Data Leaks |
| Dark Web & Threat Intelligence | Credential & data exposure on the dark web | Dark Web |
| Email Security | Business email compromise | Brand Monitoring |
| Brand Security | Brand impersonation & phishing | Brand Monitoring |
| DNS Health | DNS & domain hijacking risk | Attack Surface |
| Patching Cadence | Exploitable known vulnerabilities | Vulnerabilities |
The count on each card is the open-finding tally for that category — the same number shown on its driver bar in section 01. If no weak categories are surfaced, the section reads "No material risks surfaced for this period."
05 · The plan — next quarter
A prioritized remediation plan: the highest-impact open actions and the grade they project to.
The actions are your top open Security Rating recommendations — up to six, ranked by estimated score impact, excluding anything already resolved or dismissed. Each numbered step shows:
| Field | Meaning |
|---|---|
| Title | The action to take, e.g. "Resolve 33 Critical Alerts findings." |
| Category | Which rated category the action moves. |
| Affected | How many assets or findings the action covers. |
| Priority | The recommendation's own priority rank. |
| +N pts | The estimated points this action recovers. |
Below the list, a projection strip shows Today (current grade and score) → if executed (total points) → Projected (the resulting grade and score). The projected score is computed on the server as min(100, current score + sum of action impacts), banded to a grade — the same projection drives the hero's dashed sparkline tail and the benchmark's projected marker. If you have no open recommendations, there is nothing to project and the section reads "No open recommendations — nothing to project this period."
Projections are estimates, not a guaranteed rescore
The +N pts figures are estimated guidance. Actual movement depends on closing the underlying findings in their own modules and the next scoring run — the number can differ once ShadowMap rescans. Work the list top-down by impact; see Improving Your Score.
06 · Peer benchmark
Where your rating sits against other companies in your sector, on a 0–100 scale banded F / C / A. Markers plot your score, the sector median, and — when a plan exists — your projected score, so you can see the gap the plan closes.
The benchmark is drawn from daily rating snapshots across your sector's customer tenants. The summary line names your position — below the median, above the median, in the bottom quartile, or in the top quartile — across N peers.
A benchmark needs at least three peers
To protect individual scores, the peer comparison only appears when at least three companies in your sector have a recent snapshot. Below that threshold — or when your organization has no sector set — the section shows "Sector benchmark is coming this quarter" instead of a partial comparison. For a deeper, opt-in peer comparison you control, use the Security Rating Benchmark tab.
Export report
The Export report button in the top bar downloads the entire brief as a PDF (executive-posture.pdf). The export is rendered from the exact same composed payload as the live page, so the document a stakeholder receives matches what you see on screen. Use it for board decks and leadership updates when a live login isn't practical. For scheduled or templated reporting across modules, see Reports.
Common questions
How is this different from the Security Rating page?Security Rating is the working scorecard — eight category cards, factor chips that deep-link to findings, history charts, and a recommendations queue you act on. Executive Posture is the narrative over that same score: one scroll that explains the grade, what changed, how fast you're remediating, the top risks, the plan, and your peer standing, in language you can hand to a board. Same numbers, different audience.
How is this different from Executive Dashboards?Executive Dashboards embed your own Metabase analytics inside ShadowMap — the charts are whatever someone built in Metabase. Executive Posture is a native, fixed narrative that ShadowMap composes from your Security Rating. Reach for Executive Dashboards when you want custom analytics; reach for Executive Posture when you want the standard leadership brief with no setup.
Does Executive Posture use AI to write the report? No. The headlines and the hero thesis are templated from your numbers, not generated by a language model. The only AI here is a read-only count of what other modules' AI Review already did — findings auto-filtered and escalated this period, and the analyst-hours that saved — surfaced in the AI triage line and the Analyst time reclaimed tile. If AI Review isn't enabled anywhere, the AI triage line doesn't appear and the Analyst time reclaimed tile reads zero. See how AI is used here.
Why is the remediation velocity section empty? Velocity populates once findings begin closing in the modules that record timestamped closures (Social Media, Internal Hosts, and the CVE/KEV trackers) or once AI review reclaims analyst time. On a tenant with no recent closures in those stores, the section shows "Velocity metrics are coming this period" — that's an empty state, not an error.
Why don't I see a peer benchmark? The benchmark only shows when at least three companies in your sector have a recent rating snapshot, and when your organization has a sector set. Below that, it shows "Sector benchmark is coming this quarter." This threshold protects individual peers' scores.
The projected grade looks optimistic — is it guaranteed? No. The projection is current score + estimated impact of the listed actions, capped at 100 and banded to a grade. It assumes you close the underlying findings and that the next scoring run confirms it. Treat it as a target, not a promise.
Why did my grade fall even though I fixed things? The grade tracks open externally visible findings, and the period is a rolling 30 days. A fresh scan surfacing new issues, a certificate expiring, or a newly published breach can outweigh what you closed. Use What changed this period to see which category moved and why, then open that category on the Security Rating scorecard.
Who can open this page? Anyone with the dashboard.security-rating:read permission — the same access as the Security Rating page. If you can see your Security Rating, you can see Executive Posture.
How current is the data? It reflects the latest Security Rating and module data. The rating itself recalculates as new scans arrive (typically every few hours) and is cached briefly server-side, so a remediation you just completed may take a scan cycle to appear here. The footer's categories scored and confidence values report how much of the model was populated for this brief.
Related
- Security Rating — the scorecard and score this brief composes from; open it to act on individual categories, factor chips, and recommendations.
- Improving Your Score — the remediation playbook behind The plan; how to turn recommendations into grade movement.
- Benchmarking — the opt-in, controllable peer comparison that goes deeper than the sector benchmark shown here.
- Executive Dashboards — the other executive surface: embedded Metabase analytics, for custom charts rather than this fixed narrative.
- Dashboard Overview — the operational landing dashboard with live posture KPIs, open risk, and recent findings.
- SLA Violations — the response-time compliance behind the SLA KPI and the velocity tile.
- Reports — ShadowMap's native reporting surface for scheduled and templated exports beyond the single-click PDF here.
- AI Review — the per-module AI review whose auto-filtered and escalated counts this brief rolls up.
- Roles & Permissions — how
dashboard.security-rating:readcontrols access to this page.