
Action Center
The Action Center answers a single question — what needs me now? — with one severity-ranked queue that pulls the highest-priority open findings from seven modules into one place, so you can start your day here and work top-down instead of tab-hopping across the platform.
Overview
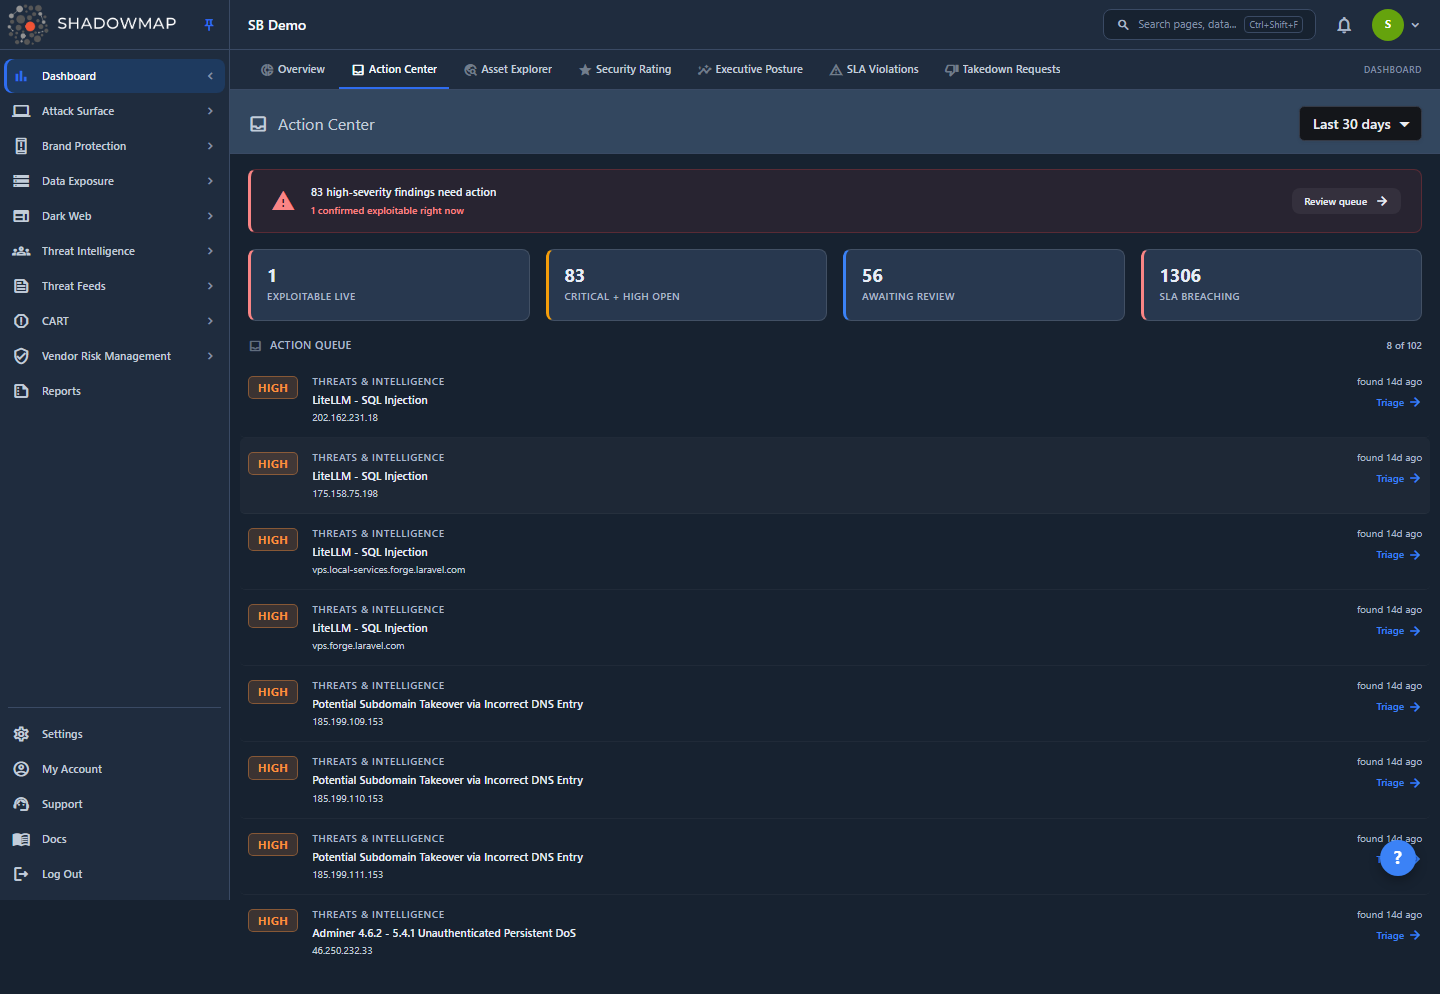
Action Center is a sibling tab of Dashboard Overview, reachable at Dashboard → Action Center. Where the Overview is a passive posture rollup built for a 30-second read, the Action Center is the active work list — a prioritized, cross-module triage queue an analyst clears from the top down.
The page is deliberately simple, top to bottom:
- Action banner — a single headline stating how many high-severity findings need action, with a red highlight and an exploitable-now sub-line when any credential or page is confirmed live. A Review queue button scrolls you straight to the list.
- Four posture counters — Exploitable Live, Critical + High Open, Awaiting Review, and SLA Breaching. These are point-in-time reads of your live open posture.
- Action Queue — the ranked list. Each row carries a risk/impact pill, the source module, the finding, its age, and a one-click action that deep-links into the owning module, positioned on that exact finding.
A date-range dropdown (top right) offers Last 7 days, Last 30 days (default), Last 90 days, Last 6 months, Last 1 year, and All time. It re-filters only the queue rows — never the banner or the counters (see How it works).
Permission and AI coverage
The Action Center is gated on the dashboard.overview:read permission — the same permission as the Dashboard Overview and Asset Explorer. Every drill-down also respects the destination module's own permissions, so you only reach findings you're already allowed to see.
The Action Center runs no AI of its own — it ranks and aggregates findings the modules have already produced. It does honour AI verdicts that two contributing modules compute: a Leaked Credentials secret the AI has judged a Confirmed Exposure keeps its High rank, and a phishing URL the AI has tagged malicious drives the Exploitable Live signal. Everything else is ranked from probe results and severity bands. See AI Review for how those verdicts are produced.
How it works
The whole page is powered by one backend call — /dashboard/widget/triage_queue. That single response carries three parts:
- a
summaryobject — the point-in-time counters that drive the banner and the four cards; - a
dataarray — the ranked rows for the queue; - a
metablock — pagination totals for theN of Mcount.
Because the banner, the counters, and the queue all read the same response, they can never disagree with one another. The counters describe the same finding set the queue is built from.
The queue honours the date range; the counters don't
This is the single most important mechanic on the page:
- The queue rows honour the date range — they list findings first detected within the last N days.
- The banner and all four counters are point-in-time. They ignore the date range entirely and always reflect your live open posture, matching the badges on the module list pages.
So changing the range re-orders and re-populates the list, but the Exploitable Live / Critical + High / Awaiting Review / SLA Breaching numbers stay put.
"Last 1 year" and "All time" both look back 180 days
The triage query clamps its window to 7–180 days. A preset shorter than that (7 / 30 / 90 / 180 days) is used as-is; Last 1 year and All time are both mapped to the 180-day ceiling. The queue is a recent-work surface, not a full historical archive — use the individual module list pages when you need to look further back.
What the four counters mean
| Counter | What it counts | How it's measured |
|---|---|---|
| Exploitable Live (red) | Confirmed-working leaked credentials + Cloud IAM artifacts with confirmed unauthenticated privileged access + phishing pages that are online and AI-tagged malicious. | Exact, live, tenant-wide database count. |
| Critical + High Open (amber) | Queue rows in the Critical or High severity band. | Derived from the ranked queue, so it always matches the list you see. |
| Awaiting Review (blue) | Queue items still sitting on a Needs Review tab in their owning module (alerts, web applications, Cloud IAM, phishing). | Derived from the ranked queue. |
| SLA Breaching (red) | Every open SLA violation — the Open and Escalated tabs together; a violation breaches until it is closed. | Exact, live, tenant-wide count across all modules. |
Two counters are exact; two track the queue
Exploitable Live and SLA Breaching are uncapped database counts — the SLA number in particular is a true tenant-wide total (it isn't limited to the modules that feed the queue). Critical + High Open and Awaiting Review are counted from the ranked queue itself, so they stay in lock-step with the rows you're actually working. Exploitable Live is deliberately narrow: it counts only probe-confirmed-working credentials (the "Confirmed Working" state), not merely AI-flagged ones, so it never over-claims.
A counter that can't be computed renders as an em dash (—) rather than a misleading 0, so an unavailable number never masquerades as "nothing there".
What the queue ranks, and in what order
Every contributing module maps its own findings onto one common row shape, and the whole set is merged and sorted by a single, deterministic, severity-first order:
| Priority | Sort key | Direction | Notes |
|---|---|---|---|
| 1 | Severity | Critical → High → Medium → Low → Informational | The primary axis (weights 50 / 40 / 20 / 5 / 1). |
| 2 | Exploitable | Confirmed-exploitable first | Only breaks ties within a severity band. |
| 3 | First detected | Newest first | A finding with no timestamp sorts last. |
| 4 | Impact score | Highest first | Final tiebreak; a null score sorts last. |
The key product decision: exploitability only breaks ties inside a severity band — it never lets a lower severity jump the queue. An exploitable High never outranks a non-exploitable Critical. Severity always wins first.
The queue shows the top slice
The dashboard surfaces the top 8 highest-priority items and shows a 8 of 102-style count so you know how deep the backlog runs. The count and the queue-derived counters reflect the triage candidate set — a bounded pull per module — so grouped, high-volume sources (stealer logs, data breaches) contribute their most relevant rows rather than their raw row count. To see everything from a source, open its module list via the row's action link.
Which modules feed the queue
Seven modules contribute. Each fetch is error-isolated — a module that fails logs to monitoring and contributes zero rows, so one broken source can never blank the whole queue. Each module only contributes its live, unresolved findings (closed, dismissed, accepted, or AI-filtered items are excluded), so the queue matches each module's own open posture.
| Source label | Findings included | Severity from | Marked Exploitable when | Row action → destination |
|---|---|---|---|---|
| Threats & Intelligence (Alerts) | Alerts detected in the window | Numeric alert risk, capped at High | Never | Triage → Alerts |
| Attack Surface (Web Applications) | Open web-application exposures | Application risk band | Never | Triage → Web Applications |
| Leaked Credentials (Secrets) | Active (unresolved) leaked credentials | Impact tier | A probe confirms the credential works | Triage → Leaked Credentials (opens the finding's drawer) |
| Cloud IAM (Cloud IAM) | Artifacts on the active review axis | Impact tier | A probe confirms unauthenticated access with privileges | Triage → Cloud IAM |
| Brand Protection (Phishing) | Unresolved phishing URLs | High if live + malicious, else Medium | The page is online and AI-tagged malicious | Take down → Phishing URLs |
| Dark Web (Stealer Logs) | Stealer-log credentials in the window | Always High | Never (grouped source) | Open → Stealer Logs |
| Dark Web (Data Breaches) | Breaches matching your monitored domains or tracked executives | Breach severity | Never (grouped source) | Open → Data Breaches |
A few module-specific notes worth knowing:
- Alerts have no Critical band — their severity is derived from a numeric risk score and hard-capped at High, so an alert never shows as Critical here. Web applications and data breaches can be Critical.
- "Confirmed working" is a probe result, not an AI guess. A leaked credential is only flagged Exploitable when an active probe authenticated it. An AI Confirmed Exposure verdict lifts a secret's severity (keeping it high in the queue) but never claims it is confirmed-working.
- Data breaches have no per-tenant table — a row can only appear here if it matches one of your monitored domains or tracked executives, i.e. one you already see in your breach list.
Anatomy of a queue row
Each row is built to be scanned in a second and to route you straight to where you act:
- One pill, never two — a finding shows an impact badge when it carries a real impact tier (only Leaked Credentials and Cloud IAM populate impact), otherwise a plain severity badge. It never shows both.
- Exploitable pill — a red pill (e.g. Confirmed working, Unauthenticated access with privileges, Live malicious page) appears only on confirmed-exploitable findings.
- Source label + title + subtitle — the owning module, the finding name, and its subject (host, IP, URL, credential, or domain).
- Age —
found todayorfound Nd ago, computed from the finding's real first-detection timestamp. - Action link —
Triage,Take down, orOpen, deep-linking into the owning module. Where the module has a per-finding detail page (alerts, web applications, phishing), you land on that finding; where it opens a drawer from a query param (Leaked Credentials), the drawer opens on that secret; grouped sources (Cloud IAM, stealer logs, data breaches) open their filtered list.
The entire row is the click target — you don't have to aim for the small action link. Rows are keyboard-accessible: Tab to a row and press Enter or Space to open it.
States you'll see
- Loading — animated skeleton rows, so the panel never flashes blank.
- Error — an inline "Couldn't load the action queue" message with a Retry button, never a blank panel.
- All clear — when nothing needs attention, the banner reads "You're all caught up" and the queue shows a "You're all clear" empty state.
Working the queue
A practical daily routine:
- Read the banner. It tells you the size of today's high-severity workload in one line, and flags anything confirmed exploitable right now. Click Review queue to jump to the list.
- Scan the four counters. Exploitable Live and SLA Breaching are your two "drop everything" signals — a live exploitable credential or a breaching SLA is time-sensitive. Critical + High Open and Awaiting Review size the backlog.
- Work the queue top-down. It's already ranked severity-first, so the top row is genuinely the most urgent thing. Open each row, act in the owning module, and come back.
- Narrow the window if the list is noisy. Switch the date range to Last 7 days to focus on what's new; widen it to catch older items still open. Remember the counters won't move — they're always live.
- Re-check the banner at the end. "You're all caught up" means the critical/high queue is clear for the current posture.
Common questions
How is the Action Center different from the Dashboard Overview? The Overview is a passive rollup — score, KPIs, donuts, coverage matrix — for a fast posture read. The Action Center is an active work list: one ranked, cross-module queue you clear from the top down. Use the Overview to understand where you stand; use the Action Center to actually work the backlog.
I changed the date range but the four counters didn't move. That's expected. The date range re-filters only the queue rows. The banner and all four counters are point-in-time and always reflect your live open posture, regardless of the range.
Why do "Last 1 year" and "All time" look the same? The queue window is clamped to a maximum of 180 days, and both of those presets map to that ceiling. The Action Center is a recent-work surface — for a full historical view, open the relevant module's list page.
The "Critical + High Open" counter doesn't match a module badge exactly. That counter is derived from the triage candidate set — the bounded pull the queue is built from — so at very high volumes it can differ from a module's exhaustive total. Exploitable Live and SLA Breaching, by contrast, are exact live counts. Open the module list for the authoritative per-module number.
A finding is flagged "Confirmed working" — what does that mean? An active probe authenticated the leaked credential (or confirmed unauthenticated privileged access for a Cloud IAM artifact, or a live malicious phishing page). It is a verified, working exposure — not an AI guess. An AI Confirmed Exposure verdict on its own raises severity but is never labelled "confirmed working".
Why don't the four counter cards link anywhere? They're read-only posture reads. The queue rows are the click targets — each one deep-links to the exact finding in its module. Use the row's action link (or click the row) to act.
One of my modules is missing from the queue. Each module fetch is isolated: if a source errors, it contributes zero rows rather than failing the page, and the failure is logged for engineering. A module also contributes nothing when it has no live, unresolved findings in the selected window — an empty contribution is normal, not a fault.
Does the Action Center use AI? Not directly. It ranks and aggregates findings the modules already produced. It does honour two AI signals computed upstream: an AI Confirmed Exposure verdict keeps a leaked credential high in the ranking, and an AI "malicious" tag on a live phishing page drives the Exploitable Live counter. All other ranking is from probe results and severity bands.
Related
- Dashboard Overview — the passive posture rollup this triage surface sits beside; start there for a 30-second read, come here to work the backlog.
- Asset Explorer — the sibling cross-module tool that pivots the same federated data by asset instead of by priority.
- SLA Violations — the source of the SLA Breaching counter and the list to work when it's non-zero.
- Alerts — a queue contributor; the destination of a
Triageaction on a Threats & Intelligence row. - Web Applications — a queue contributor; the destination of a
Triageaction on an Attack Surface row. - Leaked Credentials — a queue contributor; supplies "Confirmed working" credentials and drives the Exploitable Live counter.
- Cloud IAM — a queue contributor; supplies confirmed unauthenticated-privileged-access findings.
- Phishing URLs — a queue contributor; the destination of a
Take downaction, and the source of live-malicious Exploitable Live signals. - Stealer Logs and Data Breaches — the grouped Dark Web sources feeding
Openrows. - AI Review — how the Confirmed Exposure verdict and malicious tag the queue honours are produced.
- Severity & Status — the severity bands the ranking sorts on and the status workflow that decides which findings are "live".