Internal Hosts
Internal Hosts is the inventory of hostnames that belong to your internal estate — intranet apps, admin panels, jump boxes, and service hosts — that ShadowMap observed during external scanning. It exists to answer a specific question: which of your internal-only hosts are actually visible from the outside, and are they assets you officially manage?
Overview
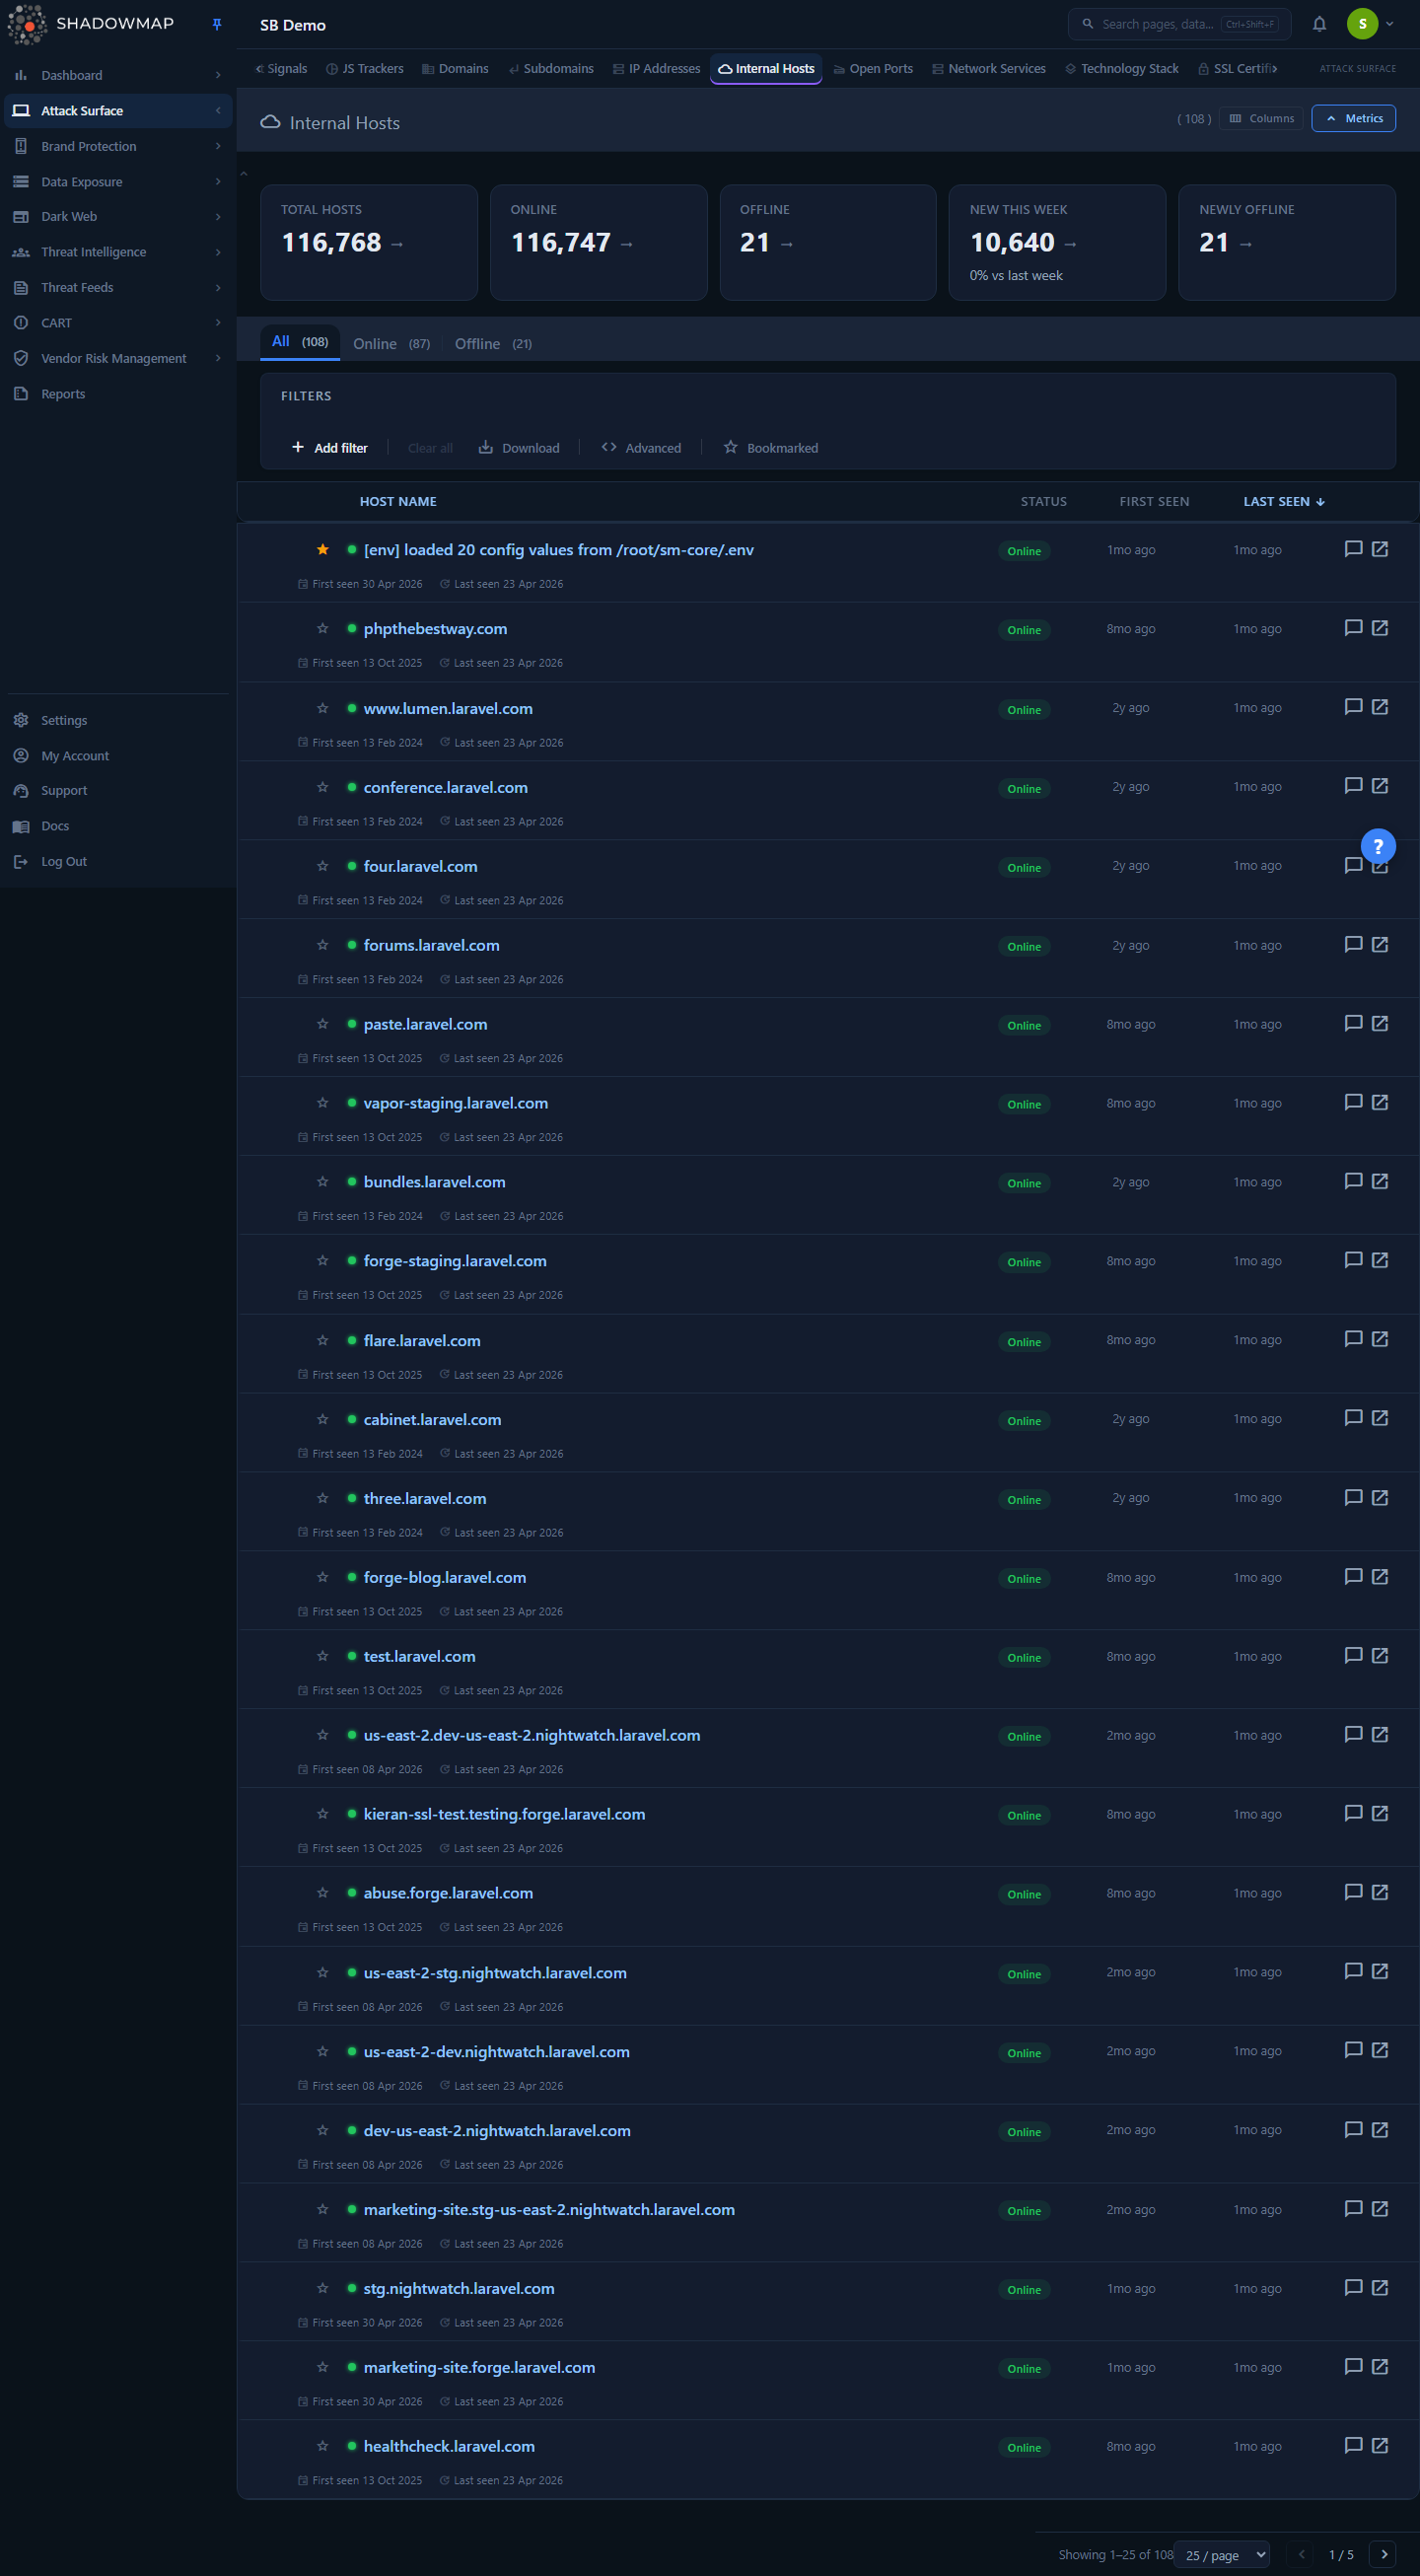
The page is a single sortable table of internal hostnames for the selected company. Above it sits a five-card metrics strip (operational KPIs), a set of status tabs (All / Online / Offline), and the standard search-and-filter bar. Each row is one hostname, with a live status dot, when it was first and last seen, how long it has been tracked, and a relevance score. Clicking a hostname opens a dedicated detail page; the open-in-new icon on the right jumps straight to the matching entries in Web Applications.
Unlike Domains, Subdomains, and IP Addresses — which catalog your public footprint — Internal Hosts is where hostnames that are not meant to be publicly resolvable show up. A host appearing here at all is a signal worth understanding.
How it works
These are the mechanics you cannot infer by looking at the table.
Where internal hosts come from
Internal hostnames are surfaced by the scan engine, not entered by hand and not (despite the name) limited to a CMDB import. Each scan session contributes the internal hostnames it found, and the most recent scan is reconciled into the per-company asset_inventory_internal_hosts table that this page reads. The reconciliation deduplicates to one row per hostname and persists records across scans. A hostname that resolved to a public IP during the same scan (i.e. it also turned up as a normal mapped host) is treated as a regular external asset and excluded — so what remains here is the set of hostnames that were referenced internally but did not resolve as public assets.
Why this matters
An internal hostname being observable from ShadowMap's external vantage point is the whole point. A hostname like jenkins.corp.internal or phpmyadmin.intranet has no business being reachable from the public internet. When one is, it usually surfaces alongside an Internal App Exposure alert — an internal application with no public DNS that is nonetheless served when its Host header is sent to a public IP. See the Alerts module for those findings.
Online vs. Offline status
Status is a single stored flag on each host, not a real-time check at page load:
- Online — the host was confirmed reachable/present on the most recent reconciliation (
status = 1). - Offline — the host is known but was not seen as reachable on the last pass (
status = 0). The record is retained for history rather than deleted.
A host flips to Offline when a scan no longer observes it. The record stays in the inventory so you keep the historical trail (first seen, how long it was tracked, when it dropped). Offline does not mean "remediated" — it means "not observed this cycle." A host that was exposed and is now Offline may simply be intermittently reachable.
First Seen, Last Seen, and Duration
- First Seen (
created_at) — when ShadowMap first recorded this hostname. This timestamp is fixed; it never changes once set. - Last Seen (
last_seen_on) — the most recent scan in which the host was observed. This is the default sort column (newest first). - Duration Tracked — computed in the browser as the span between First Seen and Last Seen. It renders compactly:
<1d,12d,4mo,1.3y. A long duration on an exposed internal host means it has been visible for a long time — prioritize accordingly.
The relevance score
The Relevance column shows a 0–100 score with a colored badge so you can triage which hosts deserve attention first. The tiers are fixed platform-wide:
| Score | Tier | Badge |
|---|---|---|
| 80–100 | Critical | red |
| 60–79 | High | orange |
| 40–59 | Medium | amber |
| 0–39 | Low | grey |
| (none) | — | em dash, no score |
A dash means no relevance score has been calculated for that host. Use relevance as a prioritization hint, not a verdict — the detail page (alerts, CMDB status, related assets) is where you confirm whether a host is a genuine problem.
Multi-tenancy and counts
Every query is scoped to the company you are currently viewing; you never see another tenant's hosts. The Total / Online / Offline counts shown on the status tabs are computed server-side over the full filtered result set, so they reflect your active filters and stay accurate regardless of which page you are on. The metrics-strip cards are company-wide totals — they summarize the whole inventory and do not narrow to your current filters. Internal scanner debug artifacts (rows whose hostname starts with [extract_apps:) are filtered out of the list, its exports, and the status-tab counts.
Understanding the data
Columns
The table is column-customizable (the column picker is in the page header). Host Name is always shown and cannot be hidden; the rest can be toggled, and your choice is remembered in your browser.
| Column | Sortable | What it shows |
|---|---|---|
| Host Name | Yes | The internal hostname. A status dot (green = Online, red = Offline) sits to its left. Click to open the detail page. |
| Status | No | The Online / Offline badge. |
| First Seen | Yes | Relative time since the host was first discovered. |
| Last Seen | Yes | Relative time since the host was last observed. Default sort, descending. |
| Duration Tracked | No | Compact span between first and last seen. Off by default — enable it in the column picker. |
| Relevance | No | The 0–100 relevance badge. |
Only Host Name, First Seen, and Last Seen are sortable — their headers are clickable and show a direction arrow. Status, Duration Tracked, and Relevance are display-only columns. Clicking a sortable header again toggles ascending/descending, and sorting resets you to the first page.
Status tabs
The tabs above the table are a quick status filter and mirror the metrics strip:
| Tab | Shows |
|---|---|
| All | Every internal host for the company. |
| Online | Only hosts currently flagged Online. |
| Offline | Only hosts currently flagged Offline. |
Metrics strip
Five KPI cards summarize posture at a glance. Clicking Total Hosts, Online, or Offline applies the matching status tab.
| Card | Meaning |
|---|---|
| Total Hosts | All internal hosts for the company. |
| Online | Hosts currently observed reachable. |
| Offline | Hosts known but not observed this cycle. |
| New This Week | Hosts first discovered in the last 7 days, with a week-over-week trend. More new hosts is treated as bad (attack surface growing) and trends up in red. |
| Newly Offline | Hosts that went Offline in the last 7 days, with a week-over-week trend. |
TIP
A spike in New This Week on internal hosts is worth a look — it can mean a fresh batch of intranet or admin hosts has started leaking externally, or that a new environment was stood up without proper DNS isolation.
Filtering & search
The search-and-filter bar drives the table. You can filter on two fields:
- Host — match on the hostname (the search/category filter, with available values and counts populated from your data).
- Status — Online or Offline.
Filters use ShadowMap's standard filter-query syntax. The free-text query box accepts expressions such as host = "jenkins.corp.internal"; you can also deep-link to a pre-filtered view by passing a q= query parameter in the URL. Applying or changing any filter resets you to the first page and clears the current selection.
Two extra controls live in the filter bar:
- Bookmarked — toggle to show only hosts you have starred. Bookmarks are per-user.
- Reset — clears all active filters.
WARNING
Filters here are strict field matches. Free-text that does not parse as a valid field = value expression will not behave like a fuzzy search across all columns — scope your query to the host field for substring-style matching.
Keyboard shortcuts
The list supports vim-style navigation (press ? on the page for the in-app help):
| Key | Action |
|---|---|
j / ↓ | Next row |
k / ↑ | Previous row |
Enter | Open the focused host's detail page |
Space / x | Toggle selection on the focused row |
/ | Jump to the search box |
Esc | Clear focus / close the help modal |
? | Toggle the shortcuts help |
Detail view
Clicking a hostname opens a full detail page. The header repeats the hostname (monospace), the status badge and dot, first seen, last seen, and total days tracked. Below it are five tabs:
Overview
Host Information (hostname, status, first discovered, last seen, duration tracked in days) plus a Metadata section that lists any key/value attributes the scanner recorded for the host (for example, associated ip entries). A View in Web Applications quick action opens the matching web apps in a new tab.
Related Assets
Three cross-link cards showing how this host connects to the rest of your attack surface, each with a live count and a click-through (opens in a new tab):
| Card | Pivots to |
|---|---|
| Web Applications | Web apps served on this hostname. |
| Subdomains | Subdomains that contain this hostname. |
| IP Addresses | IPs associated with this host via its recorded metadata. |
A card with a count of zero is not clickable. This panel is the fastest way to understand a host's blast radius — an exposed internal host with several live web apps and IPs behind it is a very different problem from a bare hostname with nothing attached.
Alerts
Security findings tied to this exact hostname, pulled from the Alerts module (hidden alerts are excluded, most recent first, up to 100). A summary strip counts them by severity — High / Medium / Low / Info — and each row shows the risk label, the ip:port it was found on, the alert's workflow status (New, Open, Investigating, Reviewed, Accepted Risk, Closed, Reopened, and so on), and when it was added. Clicking a row opens the underlying alert. An empty Alerts tab is explicitly called out as a good sign — no known findings are associated with the host.
CMDB
This tab cross-references the host against your ServiceNow CMDB and is where Internal Hosts earns its keep for asset-management and GRC teams. There are three states:
- Not configured — no CMDB integration is set up. Configure it under Settings → Integrations.
- Managed Asset — Found in CMDB — the host matched a configuration item. The panel shows CI name, class, category, environment, operational status, CMDB owner, support group, and last sync time.
- Unmanaged Asset — Not Found in CMDB — the host is not in your CMDB. This is flagged as potential shadow IT: an asset that is live in your environment but was never registered. These are the rows to chase down.
See CMDB Reconciliation for the dedicated, fleet-wide view of managed vs. unmanaged assets.
Activity
A vertical timeline of lifecycle events for the host — First Discovered, Seen Online, Went Offline, and Record Updated — derived from the host's stored timestamps and ordered newest first. Use it to answer "how long has this been exposed, and has it been flapping?"
Taking action
From the list you can:
- Bookmark a host (the star icon) to build a personal watchlist, then filter to Bookmarked to focus on it.
- Comment on a host (the comment icon on each row) using shared comment templates, to leave context for your team.
- Open in Web Applications (the open-in-new icon) to pivot directly to the apps served on that host.
Select one or more rows (checkboxes, or Space/x) to reveal the bulk action bar:
| Bulk action | Effect |
|---|---|
| Assign | Assign the selected hosts to a team member for triage. The dropdown is searchable. |
| Clear Assignee | Remove the assignee from the selected hosts. |
| Export | Export the selected hosts. |
| Share | Open the share/integration dialog to push the selection to a connected destination. |
You can also Export the entire filtered view (Excel) from the filter bar — the export respects your active filters, status tab, and sort order. Exports run as a background job; you are notified when the file is ready. See Exports for how export jobs work.
Recommended workflow
- Set the status tab to Online and sort by First Seen for the newest exposures (or scan the Relevance column to spot the highest-scoring hosts).
- Open a high-relevance host and check the CMDB tab — if it is Unmanaged, you have found shadow IT.
- Check the Alerts tab for active findings and the Related Assets tab for the live apps and IPs behind it.
- Assign the host to an owner, bookmark it, and track it to resolution.
Common questions
What exactly is an "internal host"? A hostname that belongs to your internal estate — intranet sites, admin tools, service hosts — that ShadowMap observed while scanning. The key insight is that these are not normal public assets; when they appear here and are Online, it usually means an internal-only host is reachable or referenced from the outside.
Why is an internal host showing as reachable at all? Because something is leaking it externally — most often an internal application served on a public IP via its Host header. That scenario typically also raises an Internal App Exposure alert. Treat externally reachable internal hosts as exposures to investigate, not as expected inventory.
Does "Offline" mean the host has been fixed? No. Offline means the host was not observed in the most recent scan. It could be intermittently reachable, temporarily down, or genuinely remediated — confirm with the Activity timeline and a fresh check before closing the loop.
How is this different from Subdomains or IP Addresses? Domains, Subdomains, and IP Addresses inventory your public footprint. Internal Hosts inventories internal hostnames that turned up during scanning. They overlap (a host's related assets cross-link to all three), but the security question is different: "is something internal exposed?" rather than "what do we own publicly?"
Why does a host have no relevance score (a dash)? No relevance score has been computed for it yet. Use the detail page — alerts, CMDB status, related-asset counts — to judge priority directly.
Where does the CMDB data come from? From your ServiceNow CMDB integration. If it is not configured, the CMDB tab tells you so and points you to Settings → Integrations. Once connected, every host is matched against your configuration items and labeled Managed or Unmanaged.
Can two team members see different hosts? The host inventory itself is shared across the company (scoped to the tenant). Bookmarks are per-user, so your starred set is your own. Assignments are shared and visible to the whole team.
Related
- Domains, Subdomains, IP Addresses — the public-facing siblings of this page within Asset Inventory.
- Web Applications — the apps served on an internal host; the row and detail views link straight here.
- Alerts — security findings tied to a host, surfaced on the host's Alerts tab; externally exposed internal apps appear here.
- CMDB Reconciliation — the dedicated managed-vs-unmanaged (shadow IT) reconciliation view that the host detail's CMDB tab feeds into.
- Exports — how the background export jobs used on this page work.