Your First Login
This page walks you through the very first session: signing in with the credentials your administrator provisioned, hardening your account with two-factor authentication, and reading the Dashboard Overview — the CISO-oriented landing page ShadowMap drops you on after login.
Overview
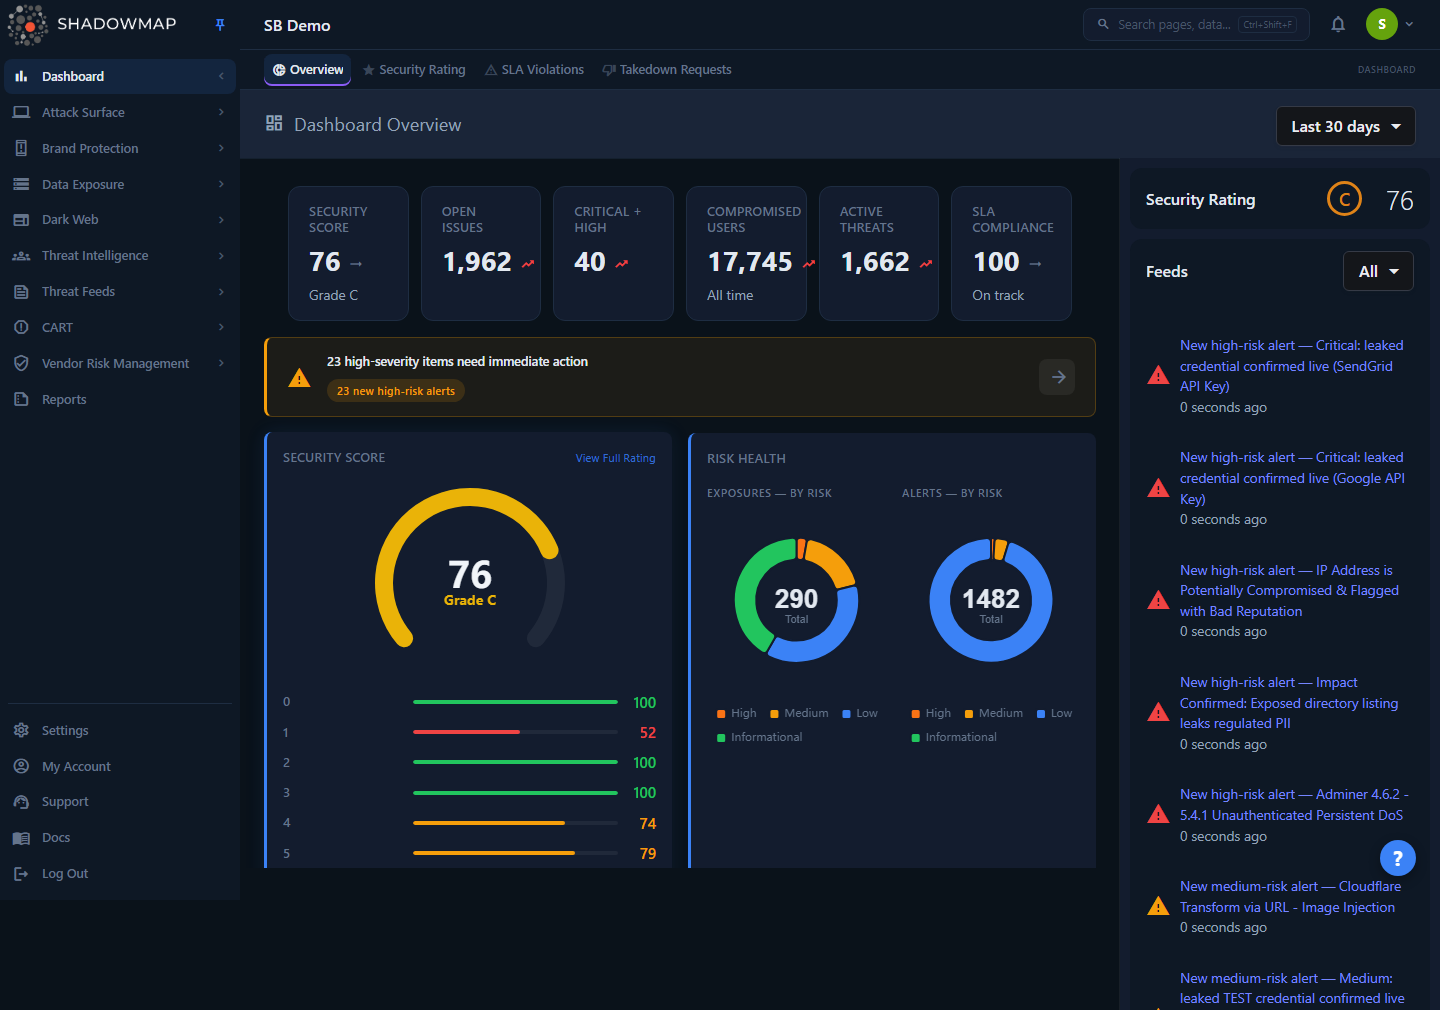
After you authenticate, ShadowMap redirects you to Dashboard Overview (/dashboard/overview). The root URL (/) and the bare /dashboard path both redirect here, so this is the single home base for every user regardless of role.
The Overview is a single scrollable page — not a tabbed report — built to answer three questions in the first ten seconds:
- Am I secure? — the Security Score gauge.
- What needs attention right now? — the Action Required banner and hero metrics.
- What changed recently? — the Recent Findings feed and module health matrix.
A date-range selector sits in the top-right of the page header (Last 7 days, Last 30 days, Last 90 days, All time; default Last 30 days). It drives the detail widgets (module health, historical trend, feeds). Your selection is remembered across visits via browser local storage.
Where the data comes from
ShadowMap is an external attack surface management platform — it discovers and monitors your internet-facing assets, brand exposure, dark-web leaks, and threat intelligence from the outside, the way an attacker sees you. The Overview aggregates findings from every module into one posture view. There is nothing to install or point at your network for this page to populate.
Logging in
- Navigate to your organization's ShadowMap instance (for the multi-tenant cloud this is
app.shadowmap.com; dedicated and on-prem tenants use the URL your admin provides). - Enter the email address and password your administrator issued.
- Click Login.
If your account was just created, you may be required to set a new password before you can continue. Passwords must be at least 8 characters.
Two factors you may hit on first sign-in
ShadowMap supports two independent second-factor mechanisms. Which ones you see depends on how your administrator configured the tenant:
| Mechanism | When it appears | What you do |
|---|---|---|
| TOTP two-factor (2FA) | If 2FA is enabled on your account (or required tenant-wide) | Enter the 6-digit code from your authenticator app on every login |
| Email OTP | If your organization enables the extra one-time-password step | Enter the code emailed to you after a successful password check |
First login with no second factor yet
If 2FA is not yet required, you'll go straight to the Dashboard Overview after entering your password. We strongly recommend enabling 2FA immediately — see below.
Setting up two-factor authentication
2FA is TOTP-based, so it works with any standard authenticator app — Google Authenticator, Authy, Microsoft Authenticator, 1Password, etc. To enable it:
- From the left sidebar, open My Account → Security (
/account/security). - In the Two-Factor Authentication section, click Enable 2FA. The current state is shown as an Enabled / Disabled badge next to the heading.
- Scan the QR code that appears with your authenticator app.
- Enter the 6-digit verification code from the app into the Enter Verification Code field.
- Click Verify & Enable.
Once enabled, the badge flips to Enabled and you'll be prompted for a TOTP code on every subsequent login. If the code is rejected, the page shows an inline error — re-check the code (they rotate every ~30 seconds) and that your device clock is accurate.
Disabling 2FA
The Disable 2FA button on the same page asks for confirmation before turning the second factor off. Some tenants enforce 2FA org-wide; in that case your administrator controls enrollment and you may not be able to disable it yourself.
The Security page also hosts Change Password (current password + new password, minimum 8 characters, plus confirmation). API tokens are not self-service from My Account — contact your administrator if you need programmatic access.
How it works
The mechanics below are not obvious from looking at the page, but they explain the numbers you'll see.
The hero metrics strip
Six cards run across the top. They are deliberately sourced from disjoint backend tables so the same finding is never double-counted:
| Metric | What it counts | Source |
|---|---|---|
| Security Score | Your overall rating (0–100) plus letter grade | Security Rating engine |
| Open Issues | New + open exposures (Applications) plus new + open alerts | Exposures table + Alerts table |
| Critical + High | High-severity items across both exposures and alerts | Severity breakdown of the two tables |
| Compromised Users | Credentials found in stealer-log infections | Stealer Logs table |
| Active Threats | New + open alerts | Alerts table |
| SLA Compliance | Percentage of SLA-tracked items still within policy | SLA engine |
Two scoping rules matter when you reconcile these against module pages:
- "New" means created in the last 7 days; "open" means status is Open/Reopened. The hero exposure, alert, and stealer-log widgets use scan-session-based windows (typically the last 7 days or the last completed scan) — they are not driven by the date-range dropdown. The dropdown affects the detail widgets lower on the page, not the hero strip.
- Compromised Users on the dashboard is an all-time tenant-wide total (note the "All time" subtitle on the card). The Dark Web Overview shows a time-windowed count, so the two surfaces can legitimately differ — they are measuring different windows of the same underlying data, not contradicting each other.
The Security Score
The Security Score card renders a gauge (0–100) with a letter grade and a per-module breakdown bar list. Each score (overall and per module) is color-coded by the same thresholds:
| Score | Color |
|---|---|
| 90–100 | Green |
| 80–89 | Lime |
| 70–79 | Yellow |
| 60–69 | Orange |
| Below 60 | Red |
The per-module bars (the security-rating categories such as Attack Surface, and so on) show where the overall grade is being dragged down. View Full Rating in the card header jumps to the detailed Security Rating page. If no scan data exists yet, the card shows "No security rating data" — the rating populates after your first scan completes.
SLA compliance math
The SLA Compliance hero card is computed as (total − open) / total, rounded, where total is open plus closed SLA-tracked violations. With no violations on record it reads 100%. At or above 90% the card reads "On track"; below that, "Needs attention." The SLA Violations card lower on the page lists the open count, closed count, and top violators, and links to the full SLA Violations list.
How findings get prioritized
The Action Required banner only appears when there are critical or high severity finding groups, showing up to five of them as clickable chips. It is the platform telling you, in one line, what to deal with first. The Recent Findings feed below it is the broader "what happened recently" list — grouped by finding type, each group carries a severity icon and a count, expands inline for groups larger than two, and clicks through to the relevant module page. When there's nothing new in the selected window, it shows an "All Clear" state.
Detection coverage matrix
The Detection Coverage grid is a compact health card per module (Web Applications, Network Services, Phishing, Data Breaches, Compromised Users, Code Repositories, S3 Buckets, and more), each showing open/closed counts and a trend. Modules with zero activity are hidden, so the grid only shows where you actually have findings. Visibility of this grid requires the Executive Summary read permission — if your role lacks it, the matrix is empty even when data exists. See Roles and Permissions.
The feeds sidebar
The right-hand sidebar is a live activity feed spanning all six domains — Attack Surface, Alerts, Dark Web, Brand Protection, Data Leaks, Threat Intelligence. You can filter it to any single domain. It respects the page date range.
Understanding what you're looking at
The Overview is organized top to bottom roughly in priority order:
| Section | Question it answers |
|---|---|
| Hero metrics strip | What's my posture in six numbers? |
| Action Required banner | What is on fire right now? |
| Security Score | Am I secure, and where am I weak? |
| Risk Health (donuts) | How are exposures and alerts distributed by risk? |
| Recent Findings | What surfaced recently? |
| SLA Violations | Am I meeting my remediation commitments? |
| Status by Action | Where are alerts in the response workflow (Needs Review / Investigating / Accepted Risk / Closed)? |
| Detection Coverage | Which modules are seeing activity? |
| Historical Trend | Is my exposure trending up or down? |
| Tracked Actors | Which threat actors are active against me? |
Most cards are interactive: clicking a risk slice in the Risk Health donuts deep-links into the filtered Web Applications or Alerts list, and finding rows navigate to their source module.
Where to go next
| Goal | Page |
|---|---|
| Learn the sidebar, search, and layout | Navigation Guide |
| Understand the platform's core terms | Key Concepts |
| See what your role can and can't do | Roles and Permissions |
| Triage your first real findings | Alerts |
| Dig into your posture grade | Security Rating |
Common questions
I logged in but the Dashboard is mostly empty / "No data" everywhere. Is something broken? Almost certainly not. A brand-new tenant populates only after the first discovery and scan cycle completes. Security Score, module health, and findings all depend on scan data; until then you'll see "No data" and "All Clear" states. Give it a scan cycle, then refresh.
Why doesn't the date-range selector change the top six numbers? By design. The hero metrics use scan-session windows (last 7 days / last completed scan) so executives always see "what's new" rather than an arbitrarily filtered count. The dropdown drives the detail widgets — Detection Coverage, Historical Trend, and the feeds sidebar.
The Compromised Users number here doesn't match the Dark Web page. Which is right? Both. The Dashboard card is an all-time, tenant-wide total (it carries an "All time" subtitle). The Dark Web Overview shows a time-windowed count. They measure different windows, so a large gap between them is expected, not an error.
The Detection Coverage / module health grid is blank but I have findings elsewhere. That grid requires the Executive Summary read permission. If your role doesn't include it, the matrix stays empty even though the underlying modules have data. Ask an administrator to adjust your role — see Roles and Permissions.
Is 2FA mandatory? It depends on your tenant. Some organizations enforce 2FA for all users; others leave it optional. Even when optional, enable it from My Account → Security — it's a TOTP code on every login and takes under a minute to set up.
I never got the email OTP code. Email OTP is a separate, optional verification step some tenants enable on top of the password. If you expect a code and it doesn't arrive, check spam, confirm the email on file with your admin, and see Login Issues.
My TOTP code keeps getting rejected. TOTP codes rotate roughly every 30 seconds and depend on your device's clock. Make sure your phone's time is set to automatic/network time and enter a fresh code. If it still fails, your administrator can reset your 2FA enrollment.
Related
- Navigation Guide — how the sidebar, modules, and universal search are laid out once you're in.
- Key Concepts — the vocabulary (assets, exposures, alerts, severity, status) the Overview assumes you know.
- Roles and Permissions — what each role can see, including the Executive Summary permission that gates the module health grid.
- Dashboard Overview — the full reference for the page you land on, widget by widget.
- Security Rating — how the 0–100 score and letter grade on the gauge are calculated.
- Account Security — manage your password and 2FA after first login.
- Login Issues — what to do when sign-in, OTP, or 2FA doesn't work.