Sharing and Integrations
ShadowMap is not a closed system. Any finding can leave the dashboard and land in the tools your team already works in — a Slack channel, a Jira ticket, a ServiceNow CMDB record, a PagerDuty incident, your SIEM, or an arbitrary HTTPS endpoint. You connect a destination once under Settings → Integrations, then route findings to it two ways: manually from a finding's Share action, or automatically through SLA policies.
Overview
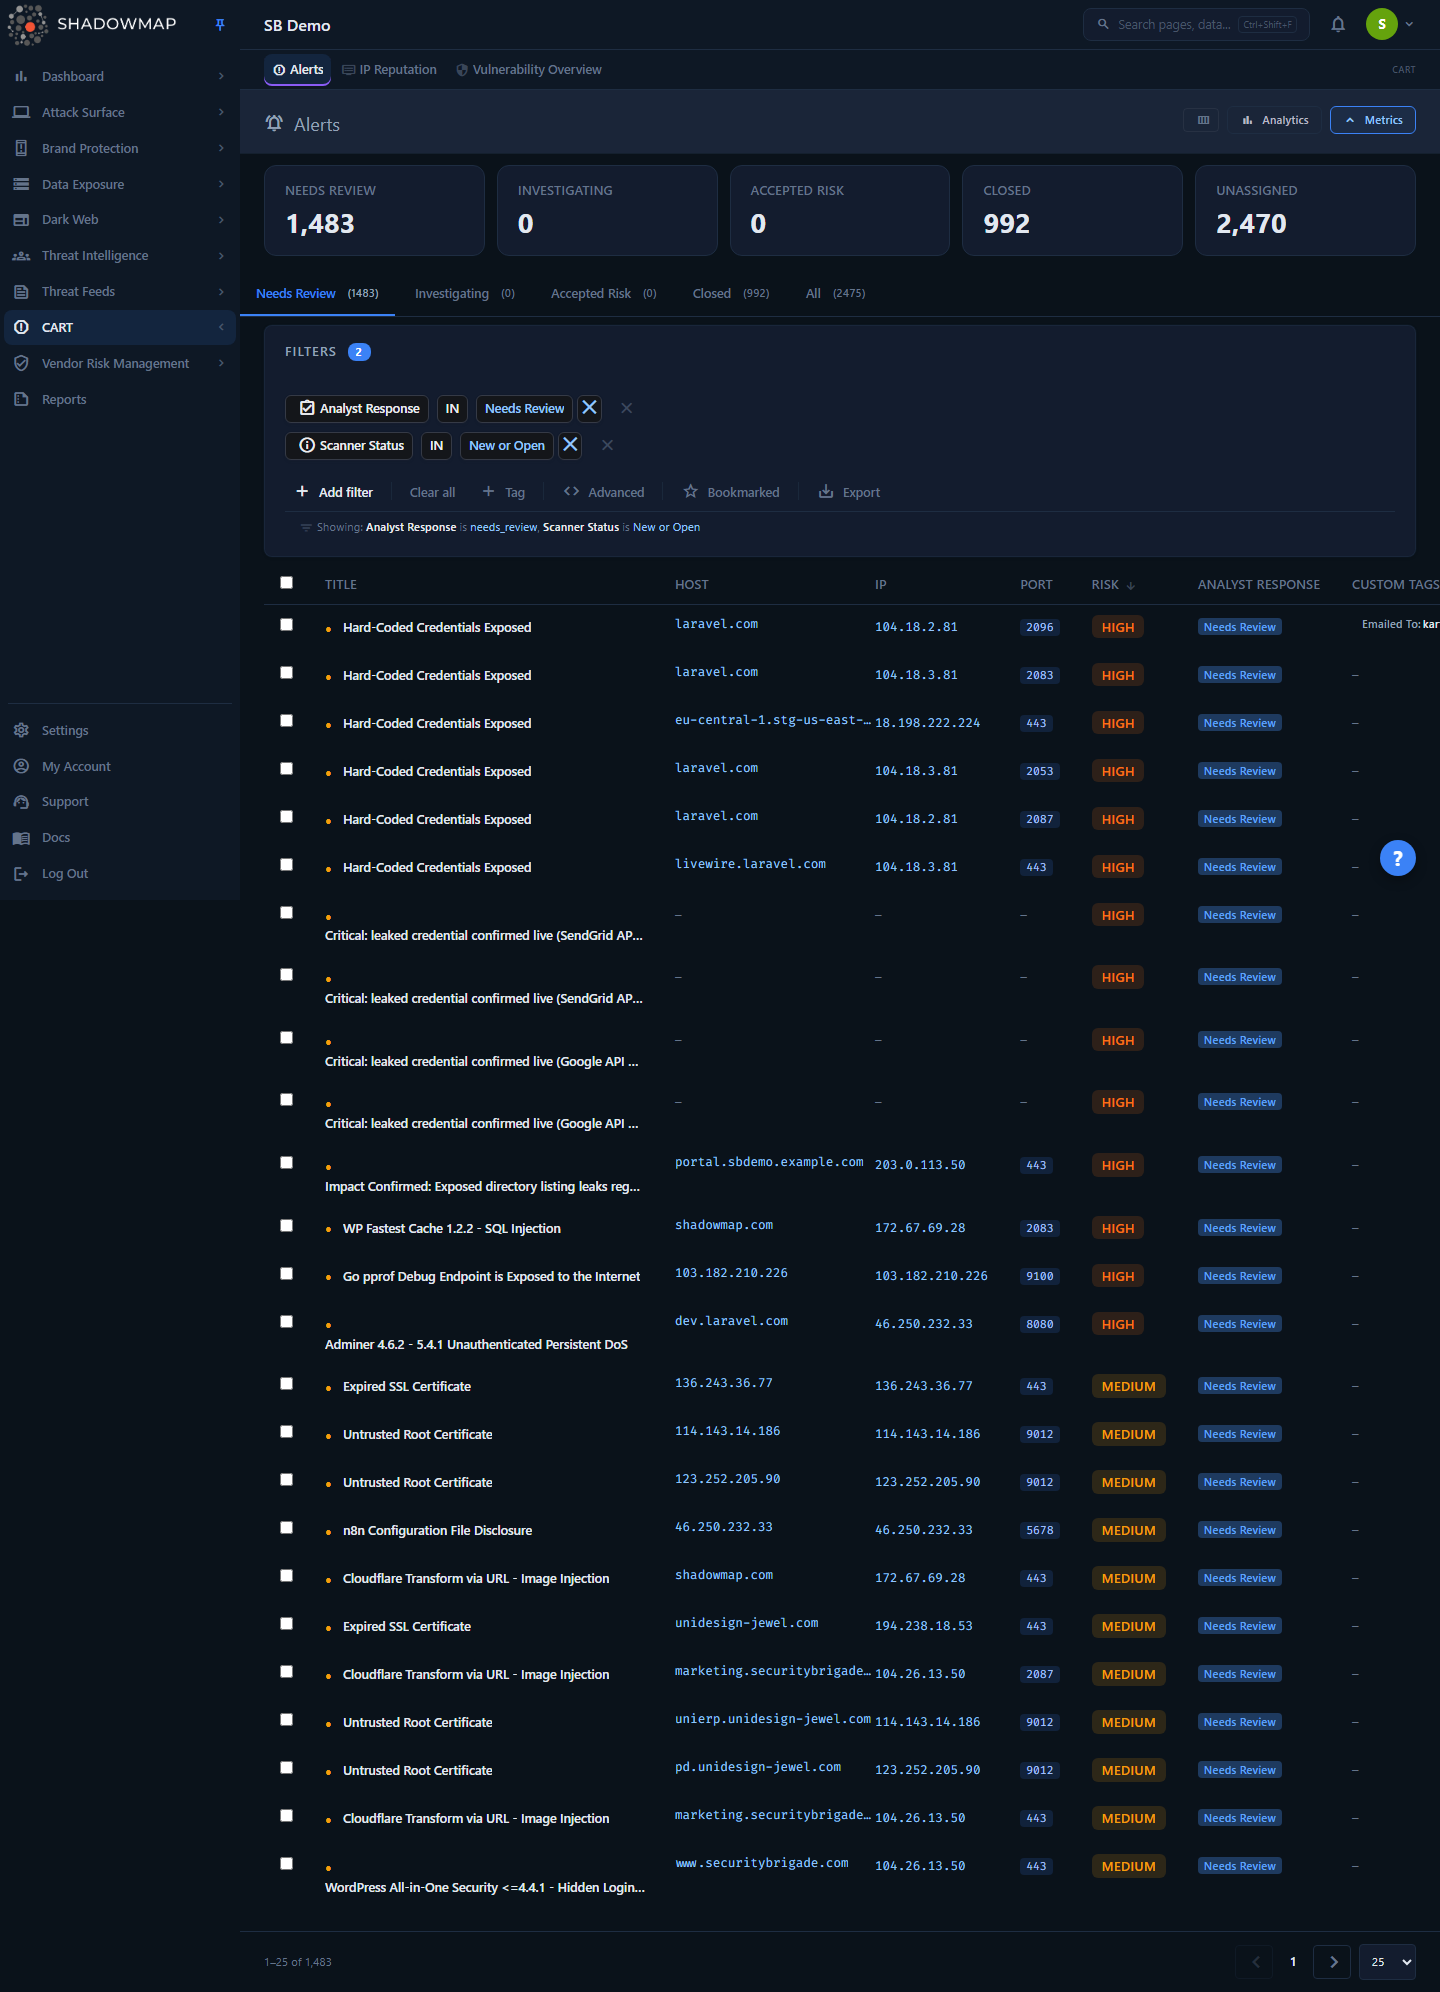
The Alerts list — the most common starting point for sharing. Select one or more rows and use the Share action to push findings to a configured integration. Destinations are managed under Settings → Integrations, where each card shows "Installed | N Configuration" and a health indicator.
The Integrations grid (Settings → Integrations) is the catalog of every destination ShadowMap can send findings to. Each card represents one integration type. A type can hold multiple configurations — for example, separate Slack webhooks for your SOC channel and your fraud channel, or a Jira connection per project. The card shows whether the type is installed, how many configurations exist, and a health dot (green / amber / red) reflecting recent delivery success.
Clicking a card opens its detail page, where you add, edit, test, enable/disable, or delete individual configurations. Once at least one configuration is active, that destination becomes selectable wherever findings can be shared.
How it works
Sharing has two completely separate delivery paths. Understanding which one you are using matters, because they offer different destinations and behave differently on failure.
Path 1 — Manual share from a finding
Open a finding (for example an Alert), use its Share action, and a modal lets you pick a destination type and a specific configuration, then sends the finding immediately. You can select multiple findings in a list and bulk-share them in one action. The same share modal is wired into 30+ module list pages, so the experience is identical whether you are sharing an alert, a phishing URL, a leaked credential, or a stealer log.
When you manually share a finding via a ticketing/chat integration, ShadowMap also auto-applies a custom tag to that finding recording where it went — for example slack:SOC-Channel, jira_service_management:SECOPS, or servicenow:Prod-CMDB. This tag is visible on the finding and filterable, so you always have an audit trail of "this finding was pushed to that system, by whom, and when." The share is also written to the finding's Activity / History timeline as a share-alert-via-integration event.
Path 2 — Automatic routing via SLA policies
SLA policies watch findings that match a rule (a severity, a module, a tag) and escalate them on a clock. The escalation channel is one of these same integrations. When a finding breaches its SLA, the SLA engine formats the violation and pushes it to the configured channel with no human in the loop. This path supports a broader set of destinations than the manual modal — including generic webhooks, Microsoft Teams, Freshservice, Splunk HEC, and SMS.
Delivery, retries, and the circuit breaker
Automated SLA deliveries are resilient by design:
- Retries with backoff. Each delivery is attempted up to 3 times — immediately, then after ~30 seconds, then after ~5 minutes — with random jitter so retries don't stampede. A 2xx response counts as success; anything else (non-2xx, timeout, cURL error) triggers a retry.
- Delivery logging. Every attempt — success or failure, with HTTP status code and a truncated response body — is recorded in an internal delivery log that powers the per-integration health indicator on the grid.
- Circuit breaker. After 5 consecutive failures, an integration is flagged unhealthy (the red dot). Crucially, ShadowMap does not auto-disable it — it keeps trying so you don't silently lose alerts — but the flag makes the broken connection visible. One successful delivery clears the flag immediately; otherwise it auto-clears after 24 hours.
- Timeouts. Outbound HTTP calls (e.g. generic webhooks) use a 30-second timeout, so a hung endpoint cannot wedge the notification pipeline.
Failure is visible, not silent
If a destination's token expires or its endpoint goes down, the integration turns red on the grid and failures are captured to monitoring with company and integration context. Check the health dot before assuming "no alerts" means "no findings."
Multi-tenant isolation
Every integration configuration is scoped to your company. When a share or SLA routing references an integration by ID, ShadowMap verifies the configuration belongs to your company before sending. You cannot read, send to, or trigger another tenant's integration endpoint.
Available integrations
The catalog below lists every integration type and the fields you provide when adding a configuration. Field requirements are enforced server-side; the Test button on the detail page sends a sample message so you can confirm the connection before relying on it.
| Integration | What it does | Configuration fields |
|---|---|---|
| Slack Webhook | Posts a formatted finding card to a Slack channel via an Incoming Webhook | Slack Webhook URL (https://hooks.slack.com/services/...) |
| Microsoft Teams | Posts a finding card to a Teams channel via an Incoming Webhook | Teams Incoming Webhook URL (https://outlook.office.com/webhook/...) |
| PagerDuty | Raises a PagerDuty event/incident | Webhook (integration) Key — 32-character routing key |
| Jira Service Management | Creates a Jira issue (cloud/DC) | Jira URL, Username/Email, API Token or Password |
| Jira Service Desk | Creates a Jira Service Desk request | Service Desk URL, Username/Email, API Token or Password |
| ServiceNow CMDB | Pushes the finding into ServiceNow (CMDB) | ServiceNow Email, Customer ID, PIN |
| Freshservice | Creates a Freshservice ticket | Freshservice Domain, API Key, Requester Email |
| SIEM (Syslog) | Streams findings to a SIEM over syslog (CEF-style formatting) | Host, Protocol (TCP/UDP), Port (e.g. 514) |
| Splunk HEC | Sends findings to Splunk via the HTTP Event Collector | HEC Endpoint URL, HEC Token, Index (optional) |
| Webhook (generic) | Posts a signed JSON envelope to any HTTPS endpoint — the universal connector | Webhook URL, Signing Secret (optional), Custom Headers JSON (optional) |
| SMS | Sends a text message via your SMS provider | Provider (Twilio / MSG91 / Exotel / Vonage), API Key, plus optional API Secret, Sender ID, Account ID |
Email is always available
Email is a built-in share destination and does not require an integration configuration. For alert-type findings, Email appears in the share modal automatically alongside any configured integrations.
Generic webhook payload
The generic webhook is the most flexible destination — it lets you wire ShadowMap into custom SOAR, internal dashboards, or automation platforms (n8n, Zapier, Tines, etc.) without a purpose-built connector. It posts a stable JSON envelope so you can build reliable automations:
{
  "event": "sla.violation",
  "version": "1.0",
  "timestamp": "2026-06-21T09:30:00Z",
  "source": "shadowmap",
  "data": { /* the finding/violation fields */ }
}
Two optional fields harden it:
- Signing Secret — if set, every request carries an
X-ShadowMap-Signature-256: sha256=<hmac>header. Verify it with an HMAC-SHA256 of the raw request body using your secret to confirm the payload genuinely came from ShadowMap (same convention as GitHub'sX-Hub-Signature-256). - Custom Headers — a JSON object of header name/value pairs (for example
{"Authorization": "Bearer <token>"}) appended to every request so your endpoint can authenticate ShadowMap.
The envelope timestamp is always UTC (...Z); pin your consumers to that shape.
Setting up an integration
- Go to Settings → Integrations. You need the Integration write permission (granted to Owners and Managers by default; Members cannot manage integrations).
- Click the card for the destination type (for example Slack Webhook).
- Click Add Integration. Give the configuration a recognizable Name — this name is what you'll pick from later when sharing, and it becomes the value of the auto-applied custom tag.
- Fill in the type-specific fields (see the table above). Secret fields like tokens, passwords, and signing secrets are write-only and never returned to the browser.
- Save, then click the Test (flask) icon on the configuration row. A successful test sends a sample message to the destination.
- Leave the configuration Active (green status dot). Use the eye / eye-off icon to disable it without deleting — disabled configurations are skipped by both manual shares and SLA routing.
Test before you depend on it
The Test action is the only way to confirm credentials and reachability before a real finding needs to go out. A configuration that saves successfully can still fail to deliver if a token is wrong or the endpoint is firewalled. Test it, and watch the health dot afterward.
To route findings automatically once a destination is configured, define an SLA policy whose escalation channel is that integration.
Sharing a finding manually
- Open the finding's detail view, or select one or more rows in a module list (such as Alerts).
- Choose Share. The Share modal opens.
- Pick a destination from the dropdown. The list shows Email (for alert-type modules) plus every integration type you have at least one active configuration for — Slack, PagerDuty, SIEM, Jira Service Management, Jira Service Desk, and ServiceNow CMDB.
- Select the specific configuration (e.g. which Slack channel or which Jira project) and confirm.
- ShadowMap sends the finding, logs the action to the finding's history, and tags it with the destination so the route is auditable.
Not every destination is in the manual modal
The manual share modal exposes Email, Slack, PagerDuty, SIEM, Jira Service Management, Jira Service Desk, and ServiceNow CMDB. Generic webhooks, Microsoft Teams, Freshservice, Splunk HEC, and SMS are automation-only destinations — configure them under Settings, then drive them through an SLA policy.
Understanding the data
What ShadowMap sends adapts to the finding type. Each integration has per-module formatters, so an alert, a phishing URL, a leaked file, a domain-squatting hit, a dark-web discussion, or a stealer-log record each render with the fields relevant to that finding — title, severity/level, a deep link back into ShadowMap, and the finding's key attributes — rather than a one-size-fits-all blob.
| Status / indicator | Meaning |
|---|---|
| Installed | N Configuration | The type has N saved configurations |
| Not Installed | No configuration of this type yet |
| Green health dot | Recent deliveries succeeded |
| Amber health dot | Degraded / warnings |
| Red health dot | Flagged unhealthy after 5 consecutive delivery failures (still retrying, not disabled) |
| Active status (green dot, detail row) | Configuration is live and selectable for shares/SLAs |
| Disabled status (red dot, detail row) | Configuration is skipped until re-enabled |
Common questions
What's the difference between sharing manually and an SLA policy? A manual share is a one-off push you trigger on a specific finding. An SLA policy is a standing rule that auto-routes matching findings to an integration on a schedule when they age past a threshold. Use manual share for "send this one to the on-call channel now"; use SLA policies for "every Critical alert that isn't closed in 24 hours opens a Jira ticket."
Why can I see an integration in Settings but not in the Share dropdown? The manual Share modal only offers Email, Slack, PagerDuty, SIEM, Jira Service Management, Jira Service Desk, and ServiceNow CMDB. Generic webhooks, Teams, Freshservice, Splunk HEC, and SMS are reachable only through SLA policies. Also confirm the configuration is Active — disabled ones are hidden.
An integration is red. Did I lose alerts? A red (unhealthy) flag means 5+ consecutive deliveries failed — usually an expired token or an unreachable endpoint. ShadowMap does not stop trying, so deliveries resume the moment the destination recovers, and one success clears the flag. Fix the credentials/endpoint and run Test to confirm. Past failures are recorded in the delivery log.
Can I have more than one Slack channel or Jira project? Yes. Each integration type holds multiple named configurations. Add one per channel/project/instance and pick the right one at share time.
Are my tokens and webhook secrets safe? Secret fields (API tokens, passwords, PINs, signing secrets) are stored server-side and never returned to the browser — the edit form shows them as empty/masked. Integrations are also strictly company-scoped, so no other tenant can use or even read your configuration.
How do I verify a webhook payload really came from ShadowMap? Set a Signing Secret on the generic webhook. ShadowMap then includes an X-ShadowMap-Signature-256 header containing an HMAC-SHA256 of the raw body. Recompute it on your side with the same secret and compare.
Who can manage integrations? Anyone with the Integration write permission — Owners and Managers by default. Members can use shared/configured integrations indirectly (via shares and policies) but cannot add, edit, or delete configurations. See Roles and Permissions.
Related
- SLA Policies — automatic routing of findings to these same integrations on a clock.
- Integrations settings — the admin page where you add, test, and manage each connection.
- Alerts — the most common source of shared findings; the Share action lives in every alert row and the detail drawer.
- Custom Tags — sharing a finding via integration auto-applies a tag recording the destination.
- Activity — every manual share is written to the activity/history timeline.
- Alert Preferences — control which findings generate notifications in the first place.
- Roles and Permissions — who can configure integrations.