Threat Intelligence
The Threat Intelligence module turns a generic threat-intel database into an organization-specific view: it correlates curated actor, malware, campaign, CVE and IOC data against the assets ShadowMap has already discovered for you, then rolls the result into a single Threat Exposure Score you can track and benchmark.
Overview
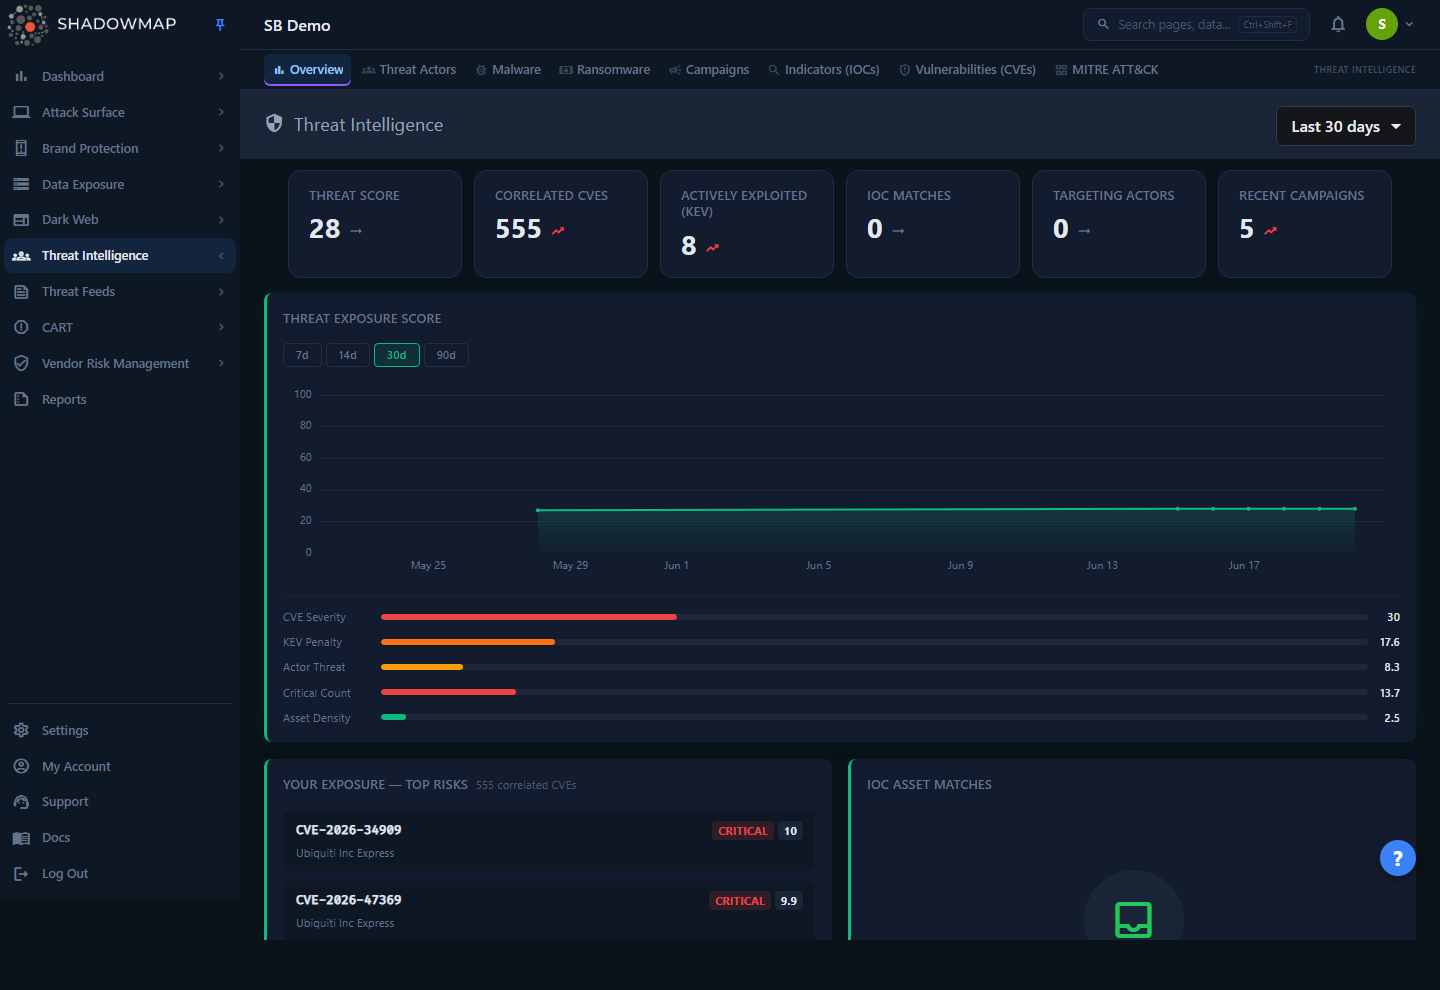
The landing page at /threat-intelligence/overview is a dashboard, not a list. It answers four questions in order of operational urgency:
- What is my overall exposure right now, and is it improving? — the Threat Exposure Score and its trend line.
- What should I patch? — Your Exposure — Top Risks, the CVEs matched to your detected technology stack.
- Are any of my assets already on a threat feed? — IOC Asset Matches.
- Who is targeting organizations like mine, and what is active this month? — Actors Targeting Your Sector and Trending (30 Days).
A date-range dropdown in the header (Last 7 days / Last 30 days / Last 90 days / All time, default 30 days) controls the score-history trend chart. The other widgets are point-in-time snapshots and are not yet date-scoped — changing the preset only re-scopes the trend line.
The module's other pages (Threat Actors, Malware, Ransomware, Campaigns, Indicators, Vulnerabilities, KEV Compliance, MITRE ATT&CK, Threat Feed, Cyber News, Media Monitoring, Regulatory Intelligence) are the underlying intelligence library; this overview is the curated, attack-surface-aware entry point into them.
Sector-aware widgets
The Actors Targeting Your Sector and sector-benchmark features only populate if your organization has a sector configured. If you see "No sector data" or "No sector configured", ask your ShadowMap administrator to set the sector on your company profile.
How it works
The value of this module is not the raw intel — it is the correlation. Three otherwise-separate data silos are joined for you:
- Your asset inventory (your tenant database): detected technologies, products, versions, IPs, domains and subdomains.
- The CVE database (shared across tenants): NVD-sourced CVEs, affected vendor/product/version ranges, CVSS metrics, KEV and ransomware-campaign flags.
- MISP threat intel (shared across tenants): threat actors, malware families, campaigns (events), and indicators of compromise.
CVE ↔ tech-stack correlation (the "Top Risks" engine)
Top Risks and the Correlated CVEs count are produced by matching your detected products against CVE affected-product data, then filtering by version:
- Collect your tech stack. Products and versions are pulled from two sources — application-level technology detection (frameworks, CMS, libraries on your web apps) and network-service detection (servers and protocols on open ports). See Technology Stack.
- Normalize product names. Scanner-detected names rarely match NVD naming. A mapping table expands, for example, detected
Apache httpdto NVD'shttp_serverso the CVE match still fires. Matching is case-insensitive on product name. - Match by product name, pulling every CVE ever filed against those products along with CVSS score, severity, KEV flag and ransomware-campaign flag.
- Filter by version. Product-name matching alone returns every historical CVE for a product, which is mostly noise. Each detected version is checked against the CVE's affected version ranges, and a match confidence is assigned:
| Confidence | Meaning |
|---|---|
| high | A detected version was confirmed to fall inside an affected range. |
| medium | The CVE has no usable version range (product-name match only), or the version comparison was indeterminate. |
| low | No version was detected for the product, so the match cannot be narrowed. |
CVEs whose ranges definitively exclude every detected version are dropped entirely.
- Attach actor context. For the top matched CVEs, ShadowMap looks up MISP events that reference the CVE and the actors linked to those events, so a risk can show "N actors" alongside the CVSS and KEV badges.
The same matched-CVE set is the shared denominator for the Vulnerabilities (CVEs) triage view, so counts do not drift between the overview and the list.
IOC ↔ asset correlation
A separate daily job checks your own infrastructure against MISP IOC feeds. Your IPs (ip-dst / ip-src), domains (domain) and subdomains (hostname) are searched against indicator values in MISP. A hit is stored as an IOC Asset Match — meaning one of your assets appears in threat intelligence, which can indicate compromise, targeting, or simply that your IP was once part of a shared range. The check is rate-limited per company (a capped number of asset lookups per run), so very large estates are sampled rather than checked exhaustively. Matches are surfaced on the overview and can be dismissed by an analyst (see Taking action).
Threat Exposure Score (0–100)
The headline Threat Score is a composite of your own exposure, computed from the correlation data above. It is graded so that higher is better (100 = no measurable exposure, 0 = maximum exposure) — the same direction as the Security Rating.
Internally a raw exposure value (worse = higher) is summed from five weighted components, each on a logarithmic curve so the first few findings move the needle most and large counts saturate rather than dominate:
| Component | Max points | Driven by |
|---|---|---|
| CVE severity weight | 30 | Number of matched CVEs × their average CVSS score |
| KEV penalty | 25 | Count of matched CVEs in CISA's Known Exploited Vulnerabilities catalog |
| Actor threat level | 20 | Distinct threat actors linked to your matched CVEs |
| Critical-count penalty | 15 | Count of matched CVEs rated CRITICAL (CVSS 9.0+) |
| Asset exposure density | 10 | Average number of affected assets per exposed product |
The final score is 100 − rawExposure, clamped to 0–100, then graded:
| Score | Grade |
|---|---|
| 85–100 | A |
| 70–84 | B |
| 55–69 | C |
| 40–54 | D |
| 0–39 | F |
Why these grade cutoffs
The thresholds are intentionally not the textbook 90/80/70/60. Most real organizations carry some CVEs and some linked actors, so conventional cutoffs would pile 80%+ of companies into "F". These bands spread organizations across A–F meaningfully.
The live score is cached for one hour per company, and a daily snapshot is written to history (a scheduled job recomputes each customer's score once a day and stores it). The trend chart plots those daily snapshots rather than recomputing on every page load.
Sector benchmarking
If your sector is configured, ShadowMap compares your latest score against the latest scores of other customers in the same sector, anonymously. It reports the sector median, 25th/75th percentiles, and your percentile rank (the percentage of sector peers with a lower — i.e. less exposed — score, so a higher rank means more exposed than peers). Benchmarking is suppressed unless at least 3 companies share your sector, and requires that peers already have historical scores. The comparison is cached for six hours.
Trending and sector-targeting widgets
- Actors Targeting Your Sector lists threat actors whose
target_sectorsinclude your sector, ordered by recent campaign volume (top 5 shown). - Trending (30 Days) ranks actors and malware families by the number of distinct MISP events (campaigns) referencing them in the last 30 days.
- Recent Campaigns shows the three most recent MISP events with their actor and malware counts.
Understanding the data
Metrics strip
Six cards summarize current posture. Each is marked "bad-trend" when non-zero, since every one represents exposure to reduce.
| Metric | Meaning |
|---|---|
| Threat Score | The composite exposure score (0–100, higher is better). |
| Correlated CVEs | Distinct CVEs matched to your detected tech stack after version filtering. |
| Actively Exploited (KEV) | Of those CVEs, how many are in CISA's KEV catalog — the highest-urgency subset. |
| IOC Matches | Active IOC asset matches not yet dismissed. |
| Targeting Actors | Threat actors whose target sectors include yours. |
| Recent Campaigns | Count of recent MISP campaigns surfaced. |
Top Risks fields
Each entry in Your Exposure — Top Risks is clickable through to the CVE detail page and shows:
| Field | Description |
|---|---|
| CVE name | The CVE identifier (e.g. CVE-2024-3400). |
| Severity | CVSS severity band (Critical / High / Medium / Low), color-coded. |
| CVSS score | Numeric base score, when available. |
| KEV | Badge present when the CVE is in CISA's Known Exploited Vulnerabilities catalog. |
| Vendor / Product | The affected vendor and product from the CVE record. |
| Asset count | How many of your detected assets run the affected product. |
| Actors | Number of threat actors linked to the CVE via MISP. |
IOC Asset Match fields
| Field | Description |
|---|---|
| Asset | Your asset that matched (IP, domain, or subdomain value). |
| Type | The asset type (ip, domain, subdomain). |
| IOC Value | The indicator value from the threat feed that matched. |
| Event | The MISP event / comment describing the indicator's context. |
Taking action
- Investigate a risk — click any Top Risk to open its CVE detail page, where the affected assets, version-match evidence and actor/campaign context are shown.
- Triage an IOC match — click the × (dismiss) on an IOC Asset Match to remove it from the active list. Use this for confirmed false positives or matches you have already investigated. Dismissal is per-tenant and does not delete the underlying threat-intel record.
- Pivot to an actor or malware family — click any row in Actors Targeting Your Sector, Trending, or Recent Campaigns to open the corresponding detail page.
- Re-scope the trend — use the header date dropdown to view the exposure-score trend over 7, 30, 90 days, or all time.
Common questions
Why is my Threat Score "good" (high) when I have open CVEs? The score is relative and logarithmic — a handful of low-CVSS, non-KEV CVEs with few affected assets contributes only a small amount of raw exposure, so the score stays high. KEV-listed and CRITICAL CVEs, and actors linked to your CVEs, move it far more. A high score means low exposure, not zero findings.
Why does the score only change occasionally rather than instantly? The score is cached for one hour and snapshotted on a schedule. The trend chart plots those snapshots, so remediation shows up as the next snapshot is taken rather than the moment you patch.
Why are some matched CVEs marked "medium" or "low" confidence? Confidence reflects how precisely the match could be version-checked. High means a detected version was confirmed inside an affected range; medium means the CVE had no usable version data or the comparison was indeterminate; low means no version was detected for that product. ShadowMap keeps indeterminate matches conservatively rather than hiding a potential exposure.
An IOC matched one of my IPs — does that mean we're compromised? Not necessarily. An IOC match means the asset value appears in a MISP indicator. That can mean active targeting or compromise, but it can also reflect shared/reassigned IP ranges or historical indicators. Treat it as a lead to investigate, then dismiss it once resolved.
Why is the sector-benchmark or "Actors Targeting Your Sector" widget empty? Both require a configured sector. Benchmarking additionally needs at least 3 customers in your sector with existing score history. If your sector is unset, these widgets stay empty by design.
Where do the underlying actors, malware and CVEs come from? Curated threat intelligence (largely MISP-sourced) for actors, malware and campaigns, and NVD-derived data for CVEs (with CISA KEV enrichment). The overview correlates that library against your discovered attack surface; the individual module pages let you browse the full library.
Related
- Vulnerability Overview — the triage list backing the Correlated CVEs count; same correlation engine.
- Technology Stack — the detected products and versions that feed CVE correlation.
- Open Ports — network-service detection, the second tech-stack source.
- Security Rating — the org-wide rating; Threat Exposure Score uses the same higher-is-better direction but scopes specifically to threat exposure.
- Alerts — where CVE-and-actor threat context enriches actionable findings.