Dark Web
The Dark Web overview is the entry point for everything ShadowMap collects from breach dumps, malware stealer logs, ransomware leak sites, dark-web forums, and Telegram channels. It rolls the four underlying sources into one set of headline metrics, two trend charts, and ranked lists of your most-exposed domains, users, and executives — so you can see the scale of your dark-web exposure before drilling into any individual finding.
Overview
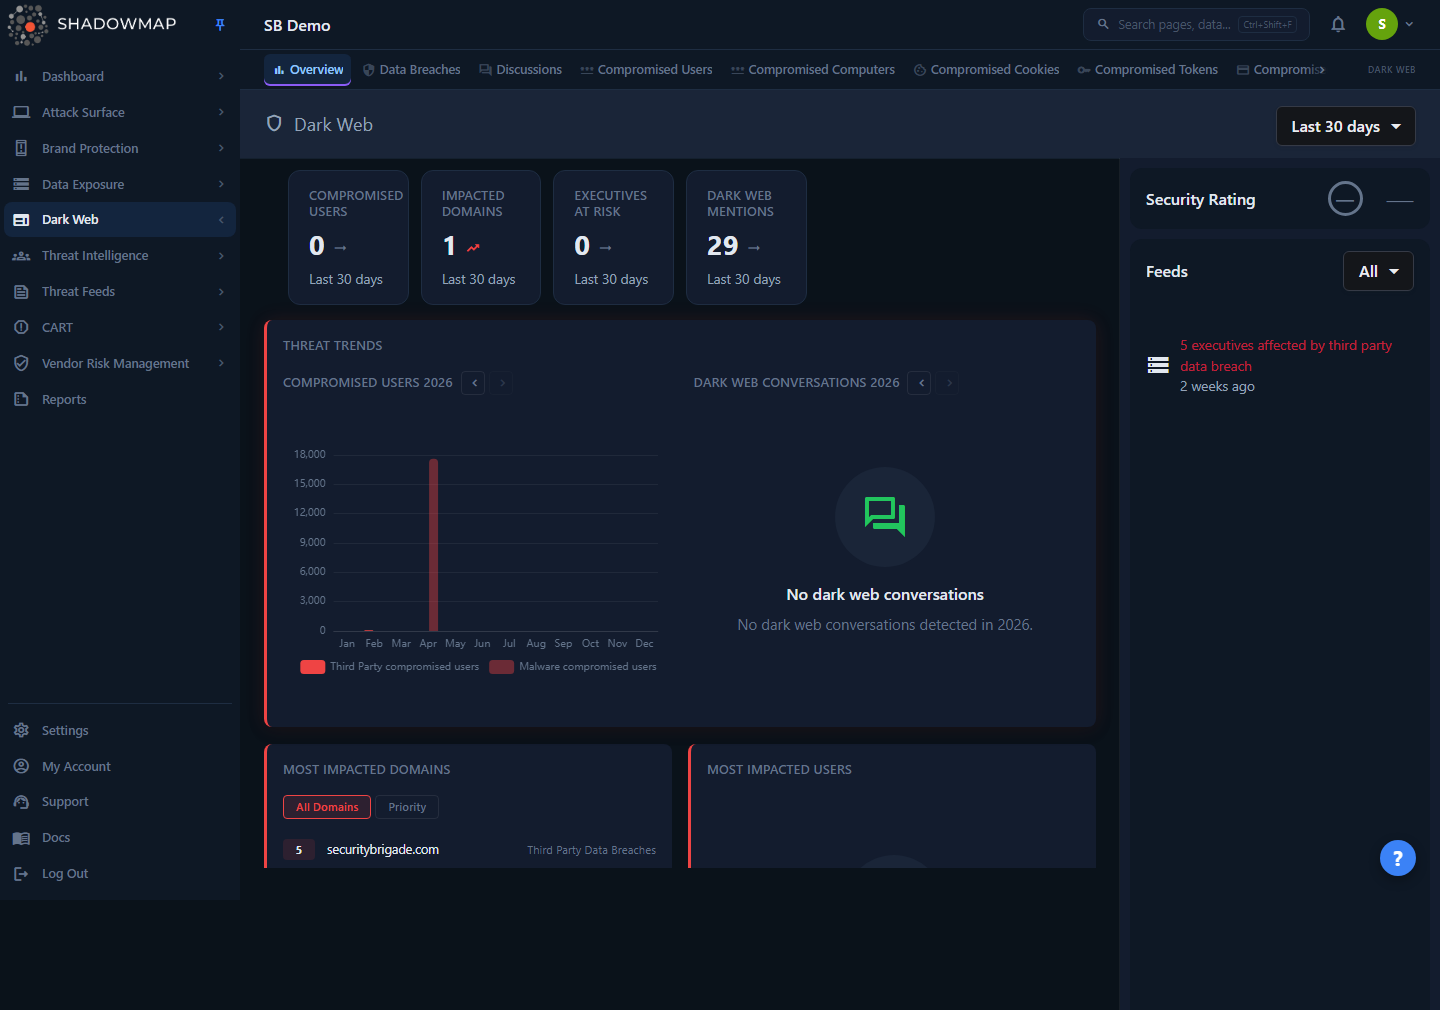
Opening Dark Web (the bare /darkweb route) redirects you to /darkweb/overview. The page has three regions:
- Metrics strip (top): four headline counts — Compromised Users, Impacted Domains, Executives at Risk, and Dark Web Mentions.
- Main column: a Threat Trends card with two monthly bar charts (Compromised Users and Dark Web Conversations), then ranked cards for Most Impacted Domains, Most Impacted Users, and Most Impacted Executives.
- Right sidebar: the Dark Web Security Rating grade and a chronological Feeds panel of the latest events across all dark-web sources.
A date-range dropdown in the page header (top right) sets the window for the date-driven widgets; it defaults to Last 30 days. (The trend charts and the Dark Web Mentions metric are exceptions — see below.)
This page is read-only and summary-only. To triage, change status, or take action on a specific finding, use the tabs across the top of the module — Data Breaches, Discussions, Compromised Users, Compromised Computers, and so on (see Related).
Required permission
This page requires the Dark Web Overview read permission (dark-web.overview). Each sub-module (Data Breaches, Stealer Logs, Discussions, Telegram) is gated by its own permission, so a user may see the overview but not every tab.
How it works
The overview does not store data of its own — it is a fan-out aggregator. Each widget queries one or more of the underlying dark-web repositories and combines the results. Knowing which source feeds which widget is the key to reading the page correctly.
The four sources
ShadowMap groups all dark-web intelligence into four feeds, each with a numeric module ID used throughout the page (notably in the Feeds filter):
| # | Source | What it is | Drill-down tab |
|---|---|---|---|
| 1 | Third Party Data Breaches | Employee/customer records (emails, password hashes, PII) exposed in breaches of other companies, matched to your monitored domains and executives. | Data Breaches |
| 2 | Malware Compromised Passwords | Credentials harvested from infostealer malware on infected machines (stealer logs), matched to your domains. | Compromised Users / Stealer Logs |
| 3 | Ransomware Groups & Forums | Posts from ransomware leak sites and dark-web forum discussions mentioning your organization. | Discussions |
| 4 | Telegram Conversations | Messages from monitored Telegram channels mentioning your organization. | Telegram |
A third stealer-log surface, labeled Compromised User Data Auctions, also contributes to the impacted-domains list (credentials/accounts being auctioned on dark-web markets).
Which widget reads which source
| Widget | Sources aggregated |
|---|---|
| Compromised Users (metric + chart) | Third Party Data Breaches + Malware Compromised Passwords |
| Impacted Domains (metric + list) | Third Party Data Breaches + Malware Compromised Passwords + Compromised User Data Auctions |
| Executives at Risk (metric + list) | Third Party Data Breaches + Malware Compromised Passwords |
| Dark Web Conversations (chart) | Ransomware Groups & Forums (leak-site posts + forum discussions) |
| Dark Web Mentions (metric) | Discussions total (ransomware/forum posts) |
| Feeds (sidebar) | All four sources, merged and sorted newest-first |
How the metrics are counted
The metric strip is computed server-side, not from the lists you see below it:
- Compromised Users — the sum of the per-record
countvalues returned for impacted users (third-party breaches + malware). Respects the header date range. - Impacted Domains — the number of distinct domain rows returned across the three impacted-domain sources. Respects the header date range.
- Executives at Risk — the sum of the per-record
countvalues for impacted executives (third-party breaches + malware). Respects the header date range. - Dark Web Mentions — the all-time Discussions total for your organization (active + investigating + legitimate + false-positive). Unlike the other three cards, this figure is not narrowed by the header date range — the count is the same whatever preset you pick, even though the card subtitle still shows the selected preset.
Counts are scoped to your monitored assets
Every figure on this page is filtered to the domains and executives ShadowMap monitors for your organization, plus any priority/relevant domains you've configured. A credential dump of a billion records will only surface the records that match your assets — the page is a measure of your exposure, not the size of the underlying breach.
Date range and how it's applied
The header dropdown offers four presets — Last 7 days, Last 30 days (default), Last 90 days, and All time — and your choice is remembered per browser. Changing it re-narrows the windowed widgets: the Compromised Users, Impacted Domains, and Executives metrics, the three ranked lists, and the feed. The two trend charts keep their own per-chart year, and the Dark Web Mentions metric is always an all-time total, so neither moves when you change the preset.
"All time" is a wide window, not "no filter"
Under the hood the backend always applies a start date. "All time" simply sends a far-past start date (2000-01-01) through today, so it covers every record ShadowMap holds. There is no truly unbounded query.
The two trend charts have their own year control
The Threat Trends card ignores the header date preset. Each chart (Compromised Users, Dark Web Conversations) shows the twelve months of a single calendar year and has its own < / > year navigator. You cannot page past the current year (the forward arrow disables once you reach it). The Compromised Users chart splits each month into Third Party vs Malware compromised users; the Conversations chart plots ransomware/forum posts per month.
Why an empty month-bar chart can still mean "no data"
If a year has only zero-count months, the chart hides itself and shows a "No compromised users / No dark web conversations detected in {year}" placeholder instead of a flat, empty axis. An empty chart cell is a deliberate empty state, not a render bug.
Understanding the data
Metric strip
Every card's subtitle shows the selected date-range preset label (e.g. "Last 30 days").
| Card | Meaning | Window |
|---|---|---|
| Compromised Users | Total user records exposed via breaches and malware, matched to your domains | Header date range |
| Impacted Domains | Distinct domains of yours appearing in breach/malware/auction data | Header date range |
| Executives at Risk | Exposed records tied to a monitored executive | Header date range |
| Dark Web Mentions | Discussions (ransomware leak-site posts + forum threads) referencing you | All-time total — ignores the header date range |
A non-zero Compromised Users, Impacted Domains, or Executives count is rendered as a "bad" trend (these are exposures you'd want at zero); Dark Web Mentions is shown as neutral.
Most Impacted Domains
A ranked top-10 list of your domains sorted by total exposure count across the three sources. Each row shows the count, the domain or subdomain (with the parent domain underneath when a subdomain is shown), and the source module the count came from.
A toggle above the list switches between:
- All Domains — every impacted domain except your configured priority/relevant domains.
- Priority — only your configured priority/relevant domains.
This split lets you separate exposure on the assets you care most about from the long tail. Priority/relevant domains are configured under settings; see Priority Subdomains.
Most Impacted Users and Most Impacted Executives
Two ranked top-10 lists, each showing count, the exposed identifier (email/username for users; the executive's matched value for executives), and the source module. Both lists draw from third-party breaches and malware-compromised passwords. Executives are matched against the executive watchlist you maintain for the organization.
Feeds (sidebar)
A reverse-chronological stream of the most recent individual events across all four sources, each with an icon, a human-readable title, and a relative timestamp (e.g. "2 weeks ago"). Examples:
5 executives affected by third party data breach{n} {credential type} compromised by MalwareNew Ransomware: {post title}/New Dark Web Forum Discussion: {title}New Telegram Conversation: {channel name}
Each entry links to the relevant drill-down tab. A multi-select dropdown — labeled All when nothing is selected, or Selected ( N ) once you pick sources — filters the feed to one or more of the four sources (Third Party Data Breaches, Malware Compromised Passwords, Ransomware Groups & Forums, Telegram Conversations). When there is nothing to show, the panel reads "No feeds to show."
Security Rating
The grade at the top of the sidebar is the Dark Web module's contribution to your overall ShadowMap score, shown as a letter grade and numeric value. If the score hasn't loaded for your tenant it renders a muted "—" rather than a phantom "F 0". See Security Rating for how module scores roll up.
Filtering & search
The overview itself exposes only two controls: the header date-range preset (applies to the windowed metrics, the ranked lists, and the feed — but not the all-time Dark Web Mentions metric) and the Feeds source filter. The trend charts are filtered separately by their per-chart year navigator.
Granular filtering — by domain, status, breach name, date, severity, and so on — lives inside each drill-down tab, not on the overview. Use the overview to spot where the exposure is, then open the relevant tab to investigate and act.
Taking action
There are no triage actions on the overview. It is a launchpad: read the metrics and ranked lists, then click into the tab that owns the finding to mark status, assign, comment, export, or request a takedown.
| If you see... | Go to |
|---|---|
| High Compromised Users, or impact on a specific domain | Data Breaches and Stealer Logs (Compromised Users) |
| A compromised machine to investigate | Compromised Computers |
| Ransomware or forum chatter naming you | Discussions |
| Telegram channel mentions | Telegram |
| An exposed payment card | Credit Card Leaks |
Common questions
Why does a metric card show 0 when I can see bars in the trend chart? The metric cards and the trend charts use different windows. The cards reflect the header date preset (default Last 30 days), while the charts show a full calendar year. If your most recent exposure is older than the selected preset, the cards can read 0 while the chart for that year still shows activity. Switch the header to All time, or page the chart to the relevant year, to reconcile them.
Are these numbers the size of the breach, or my exposure? Your exposure. Every figure is filtered to your monitored domains and executives. A breach of hundreds of millions of records contributes only the rows that match your assets.
What's the difference between "All Domains" and "Priority" on the impacted-domains card? "Priority" shows only the domains you've flagged as priority/relevant in settings; "All Domains" shows everything else. The two views are mutually exclusive — a priority domain never appears under "All Domains."
Why does the Dark Web Conversations chart say "No dark web conversations" but the Mentions metric is non-zero, or vice versa? The chart is scoped to a single calendar year, while the Mentions metric is an all-time total that never narrows to a date range. Different windows can legitimately disagree. To see whether a given year had activity, page the chart to that year — the Mentions metric won't change because it always counts every discussion ShadowMap holds for you.
Which sources feed "Compromised Users"? Third-party data breaches and malware-compromised passwords (stealer logs). Ransomware/forum discussions feed the Dark Web Conversations chart and the Dark Web Mentions metric, not the Compromised Users count. Telegram messages feed only the Feeds sidebar — they are not counted in the Mentions metric or the Conversations chart.
Can I export the overview? The overview is a summary dashboard and has no export. Export individual findings from the drill-down tab that owns them, or use Reports for a packaged deliverable.
Why did old /darkweb/credit-card, /darkweb/discussions, or /darkweb/stealer-logs links land somewhere else? The module migrated to v2 routes. Legacy URLs (and bookmarks/emails) redirect automatically — for example credit-card links now resolve to the compromised cards view, and v1 discussions/stealer-logs links resolve to their v2 equivalents.
Related
- Data Breaches — triage third-party breach records matched to your domains and executives (source #1).
- Compromised Computers — machines infected by infostealer malware that produced the stealer-log credentials (source #2).
- Stealer Logs — the compromised credentials, cookies, tokens, and other artifacts from malware logs.
- Discussions — ransomware leak-site posts and dark-web forum threads (source #3).
- Telegram — monitored Telegram channel mentions (source #4).
- Credit Card Leaks — exposed payment-card data from stealer logs.
- Dark Web (module index) — this page.
- Leaked Credentials — credential exposure tracked under Data Leaks; complements the dark-web view.
- Priority Subdomains — configure the priority/relevant domains that drive the "Priority" toggle.
- Security Rating — how the Dark Web module's grade rolls into your overall score.