Data Leaks
The Data Leaks overview (labelled Data Exposure in the product) is the landing page for everything ShadowMap finds where your organization's data, credentials, or infrastructure detail has spilled onto publicly reachable surfaces — public code repositories, Docker registries, S3 buckets, document-sharing sites, exposed API endpoints, URL shorteners, and Elasticsearch instances. It answers one question fast: where is my data leaking right now, and how bad is it?
Overview
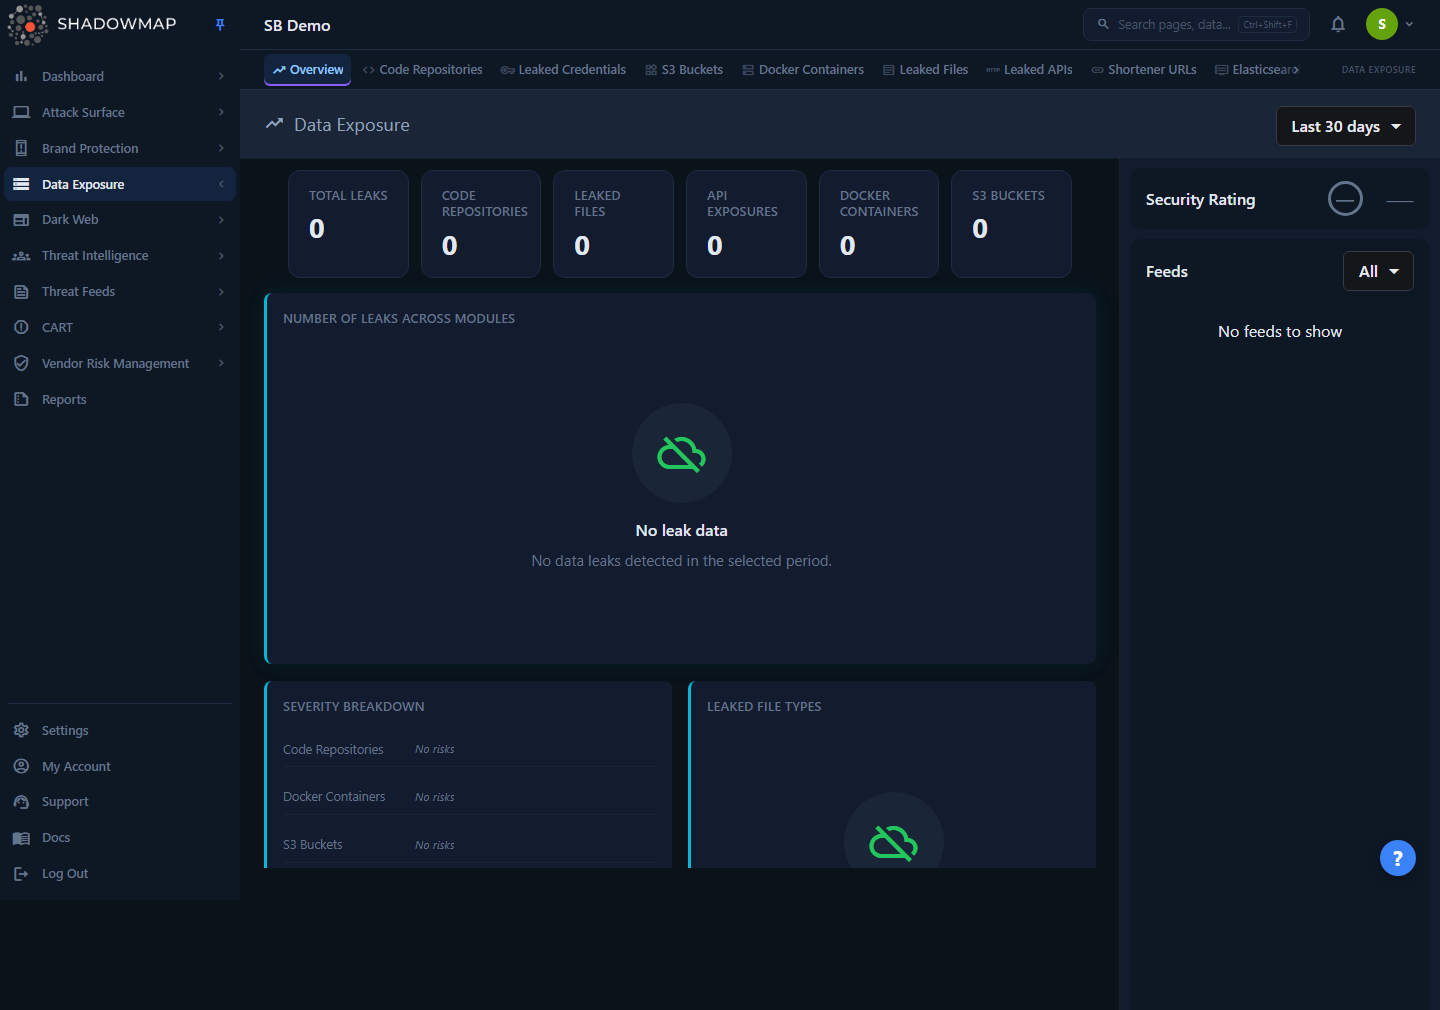
The page is a read-only dashboard, not a worklist. It rolls up the six headline leak sources into one view so you can triage from the top down:
- A metrics strip with the total leak count and a per-module breakdown.
- A "Number of Leaks Across Modules" bar chart — the visual answer to "which surface dominates my exposure?"
- A Severity Breakdown grid showing critical/high/medium/low counts per module.
- A Leaked File Types donut with a threat-level summary.
- A Top Exposed Subdomains table merging the subdomains seen in leaked APIs and shortened URLs.
- A right-hand Feeds sidebar with the most recent finding from every module, plus this module group's Security Rating grade.
Every number, bar, and badge is a jumping-off point: clicking through takes you to the individual module's filtered list, where the actual investigation and status work happens.
Where the detail lives
This overview summarizes; it never lets you change a finding's status. To review, dismiss, or action individual leaks, open the relevant module from the sidebar or by clicking a chart element. See Code Repositories, S3 Buckets, Docker Containers, Leaked Files, Leaked APIs, and Shortened URLs.
How it works
The mechanics behind this page are not obvious from the UI — understanding them prevents you from misreading the numbers.
The time range filter drives everything
The dropdown in the page header (top right) is the single control for the whole page. It offers four presets:
| Preset | Window |
|---|---|
| Last 7 days | Findings seen in the last 7 days |
| Last 30 days | Findings seen in the last 30 days (default) |
| Last 90 days | Findings seen in the last 90 days |
| All time | Everything ShadowMap has ever found |
Each module applies the window against its own date column (when a finding was first seen, leaked, or last updated, depending on the source), so the preset is a recency filter rather than a strict "first seen" cut-off.
Changing the preset re-fetches every card, chart, and the feed list. Your selection is remembered in the browser (per overview page) so you land on the same window next visit. The default is Last 30 days, which means the headline number you see on first load is not your all-time exposure — switch to All time for the full picture.
Counts here are scoped to your live attack surface
The module totals reconcile with the online / still-visible scope each module shows, not raw ingestion counts. Code Repositories in particular uses the same "visible" scope as its module page, so the overview number matches what you see when you open the module — it deliberately excludes dismissed and offline findings rather than counting every row ever seen. This is why the overview total can be much smaller than a raw database count.
What each leak source is
The six modules summarized here detect distinct classes of exposure:
| Module | What it finds |
|---|---|
| Code Repositories | Public Git repositories (e.g. GitHub) carrying your code, internal references, or secrets. Each repo is scanned for leaked files and secrets. |
| Docker Containers | Public container registry images (e.g. Docker Hub) published under or referencing your organization, scanned layer-by-layer for leaks. |
| S3 Buckets | Publicly accessible cloud storage buckets tied to your brand. |
| Leaked Files | Documents exposed on file-sharing/paste sites and analysis platforms, classified by file type and a threat verdict. |
| Leaked APIs | API endpoints exposed in public sources, grouped by the subdomain they belong to. |
| Shortened URLs | Short links (bit.ly-style) pointing at your assets that expose internal or sensitive destinations, grouped by destination subdomain. |
Elasticsearch instances and Open Databases are also part of the Data Leaks module group and reachable from the sidebar, but they are not rolled into the six headline metrics on this overview.
How "Total Leaks" is computed
The Total Leaks metric is the simple sum of the six module counts (Code Repositories + Leaked Files + Leaked APIs + Docker Containers + S3 Buckets + URL Shorteners) for the selected time window. There is no de-duplication across modules — a piece of data that surfaces in two sources counts in both. Treat the total as a volume indicator, not a unique-incident count.
No trend arrows — by design
The metric cards intentionally show no up/down trend indicator. A real period-over-period delta isn't computed for these cards yet, so rather than show a misleading arrow, ShadowMap shows none. Don't read the absence of an arrow as "no change" — it means "not measured." To compare periods, switch the time range preset and read the numbers directly.
Severity is per-module, and clickable
The Severity Breakdown card lists each module (Code Repositories, Docker Containers, Leaked APIs, S3 Buckets, URL Shorteners) with a row of severity badges — a coloured initial (the first letter of the band) and a count. The bands are Critical, High, Medium, Low, and Informational. Note that Leaked Files is not in the Severity Breakdown — it has its own Leaked File Types and Threat Level cards instead. These badges reflect the risk assigned to the underlying findings in each module.
Each badge is a deep-link: clicking (or pressing Enter/Space) navigates to that module's list, pre-filtered to the chosen severity (e.g. clicking the High badge on Docker Containers opens the Docker list with risk = "high" applied). The destination tab is chosen per module so it contains the same population the badge counted — Code Repositories and Docker Containers land on their all tab, while Leaked APIs and Shortened URLs land on their online tab. The severity value is passed through in the module's own casing/type, so the filtered list matches the badge's count.
Leaked file types and threat levels
The Leaked File Types donut groups leaked documents by file type. Types are collapsed to a parent label (the first two words of the type string) so many granular MIME variants roll up into readable categories; unrecognizable hash-like type strings are bucketed as Unknown.
Below the donut, a Threat Level summary shows how many leaked files carry each verdict:
| Threat level | Meaning |
|---|---|
| Malicious / Suspicious | File flagged as a genuine threat (shown in red) |
| Ambiguous | Inconclusive verdict (shown in amber) |
| No Verdict / No Specific Threat | Scanned, nothing dangerous found (shown in green) |
| Unknown | No threat classification available |
Top Exposed Subdomains merges two sources
The Top Exposed Subdomains table combines the subdomains appearing in Leaked APIs and Shortened URLs into one ranked list (top 10 by count). The Source column tells you which feed each row came from — API or URL Shortener. This is the fastest way to spot a single subdomain that is leaking heavily across both channels.
The Feeds sidebar
The right sidebar shows a live, merged stream of the most recent finding across all six modules, newest first, with a relative timestamp and an icon per module. It paginates as you scroll and can be filtered to specific sources (Code Repositories, S3 Buckets, Docker Containers, Leaked Files, Leaked APIs, URL Shorteners) via the dropdown. Each feed item links straight to that finding's detail page. Above the feed, the Security Rating badge shows your letter grade and score for the Data Leaks module group — or a muted — if no score has been computed for your tenant yet.
Reading the page
| Element | What it tells you | Click target |
|---|---|---|
| Total Leaks card | Combined volume across all six sources for the window | — |
| Per-module cards (Code Repositories, Leaked Files, API Exposures, Docker Containers, S3 Buckets) | Volume in each source | — |
| Leaks Across Modules bar chart | Which surface dominates your exposure (linear scale, value labels) | Opens that module's list |
| Severity Breakdown badges | Critical/High/Medium/Low counts per module | Opens module list filtered to that severity |
| Leaked File Types donut | Distribution of leaked document types | — |
| Threat Level summary | How many leaked files are malicious/suspicious vs benign | — |
| Top Exposed Subdomains | Subdomains leaking the most via APIs and short links | — |
| Feeds | Newest individual findings across every module | Opens that finding's detail page |
Prerequisites
- Access to the Data Leaks overview requires the Data Leaks read permission (granted via your role). Without it, the module group is hidden from the sidebar. See Roles & Permissions.
- The overview only shows data once the underlying scanners have run for your organization and seeded the individual modules. New tenants will see empty-state cards ("No leak data", "No leaked files") until the first scans complete — the bar chart deliberately renders an empty state rather than zero-height bars in that case.
Common questions
Why is the total here smaller than what I saw last week? The page defaults to Last 30 days. If you opened it earlier on All time (or the selection was reset), the windows differ. The dropdown remembers your last choice per browser, but always confirm the active preset before comparing numbers.
The total doesn't match the sum I get adding up the module pages — why? The overview counts each module's online/visible scope and sums them with no cross-module de-duplication. Module list pages can show different totals depending on which status tab you're on (e.g. "needs review" is a subset of "all"). When in doubt, click the bar or severity badge — it lands you on the exact filtered list that produced the overview number.
Can I dismiss or action a leak from this page? No. The overview is read-only. Click through to the module (via a bar, a severity badge, or the sidebar) to triage, mark as investigating, or dismiss individual findings.
What's the difference between "Leaked Files" and "Code Repositories"? Leaked Files are individual documents found on sharing/paste/analysis sites. Code Repositories are whole public Git repos attributed to your org; ShadowMap scans inside each repo for both files and secrets. A secret found inside a repo is part of that repo's leaks, not the Leaked Files count.
Why don't the metric cards show a trend arrow? A reliable period-over-period delta isn't computed for these cards yet, so ShadowMap deliberately omits the arrow rather than show a misleading one. Compare periods manually by switching the time-range preset.
Where are Elasticsearch instances, Open Databases, and Stack Overflow leaks? They belong to the Data Leaks module group and are reachable from the sidebar, but they are not part of the six headline metrics on this overview. Open Elasticsearch Instances, Open Databases, or Stack Overflow directly.
Related
- Code Repositories — public Git repos leaking your code and secrets; one of the six headline sources.
- S3 Buckets — publicly exposed cloud storage tied to your brand.
- Docker Containers — public container images scanned for leaks.
- Leaked Files — documents exposed on sharing and analysis sites, with threat verdicts.
- Leaked APIs — exposed API endpoints grouped by subdomain.
- Shortened URLs — short links exposing internal or sensitive destinations.
- Leaked Credentials — exposed username/password pairs for your domains.
- Elasticsearch Instances and Open Databases — exposed data stores in the same module group, not summarized on this overview.
- Data Leaks Overview — the detailed overview page within the module group.
- Security Rating — how the Data Leaks grade shown in the sidebar is calculated.
- Severity Levels — what Critical/High/Medium/Low mean across ShadowMap.